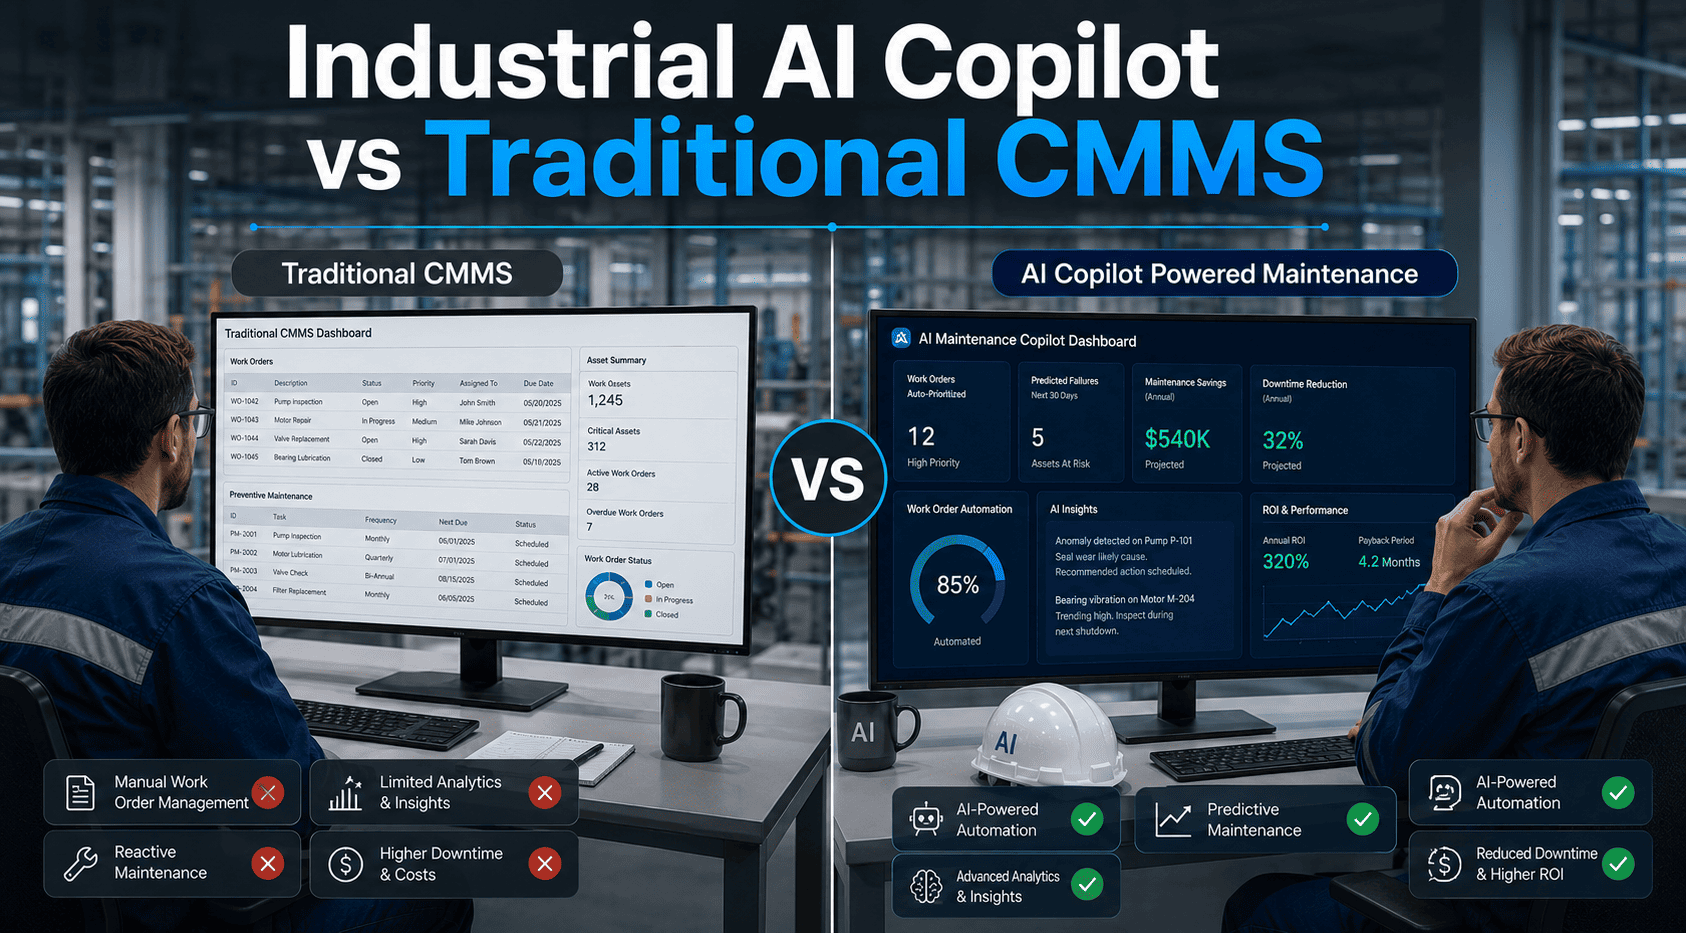
A 200-person manufacturing plant spent $2.4 million on maintenance in the previous year — 68% of it reactive. The maintenance manager knew things needed to change but could not get budget approval for a CMMS because the CFO wanted a business case with specific dollar amounts, not vague promises of "improved efficiency." So the manager built the ROI case from the plant's own numbers: $50 billion in annual unplanned downtime costs the US manufacturing sector, but this plant's share was $847,000 in production losses from 312 hours of unplanned equipment failures. Reactive repairs were costing 4–6x more than planned maintenance. Technicians were spending only 28% of their shifts on actual wrench time — the rest was walking, waiting, searching, and typing. The CMMS cost $18,000 per year. The projected savings: $340,000 in year one from a 25% reduction in unplanned downtime, a 15% reduction in maintenance labor waste, and a 20% reduction in emergency parts spending. The actual result after 12 months: $412,000 saved. The CMMS paid for itself in 16 days. That is not an exceptional outcome — it is the documented average. Plants deploying CMMS report 15–30% maintenance cost reductions, 25–50% downtime decreases, and ROI within 3–6 months. The question is not whether CMMS delivers ROI. It is how to calculate your specific facility's savings so the CFO signs off. Book a demo to build a custom ROI case for your facility with OxMaint.
CMMS · ROI Calculator · OxMaint
CMMS ROI Calculator: How to Calculate Your Maintenance Savings
Five savings categories, proven reduction percentages, and the formula that turns your facility's numbers into a CFO-ready business case.
Most facilities achieve full CMMS ROI within 3–6 months
$50B
annual cost of unplanned downtime to US industrial manufacturers — your facility's share is calculable
4–6x
higher cost of reactive repairs vs. planned maintenance — the multiplier CMMS eliminates
15–30%
documented maintenance cost reduction in first 12 months after CMMS deployment
3–6 mo
typical payback period — most facilities recover their entire CMMS investment within two quarters
Category 1
Downtime Reduction — The Largest Savings Category
Formula
Downtime Savings = Unplanned Hours x Hourly Cost x Reduction %
Unplanned downtime costs $260,000 per hour on average in industrial manufacturing. Even small facilities lose $50,000–$500,000 annually to equipment failures that preventive maintenance would have caught. CMMS-driven PM programs reduce unplanned downtime 25–50% in the first year by catching failures before they happen.
Your Calculation
Step 1: Count your annual unplanned downtime hours (from shift logs or production records)
Step 2: Calculate the hourly cost of downtime (lost production + emergency labor + expedited parts)
Step 3: Multiply by 25% (conservative) to 40% (typical) reduction with CMMS-driven PM
Example: 312 hrs x $2,716/hr x 30% reduction = $254,000 annual savings
OxMaint: PM scheduling with automated alerts prevents the missed inspections that cause 60–70% of unplanned failures. Track downtime by asset, cause, and shift — quantifying every hour saved.
Category 2
Labor Productivity — Getting More From the Team You Have
Formula
Labor Savings = Technicians x Annual Cost x Wrench Time Improvement
Average wrench time in most plants: 25–35%. That means 65–75% of a technician's paid shift is consumed by walking, waiting for parts, searching for information, getting approvals, and paperwork. CMMS with mobile work orders, digital asset records, and pre-staged parts raises wrench time to 55–65% — effectively doubling productive output without adding headcount.
Your Calculation
Step 1: Count your maintenance technicians and their fully loaded annual cost
Step 2: Estimate current wrench time (most plants: 28–32% without mobile CMMS)
Step 3: Calculate the value of moving to 55%+ wrench time — effectively gaining hours per technician per day
Example: 10 techs x $85K avg cost x 35% productivity gain = $297,500 recovered labor value
OxMaint: Mobile work orders eliminate the walk-back-to-desk bottleneck. QR asset scanning delivers history instantly. Auto-approval routing ends wait-for-signature delays.
Categories 3–5
Parts, Asset Life, and Compliance — The Compounding Categories
03
Parts & Inventory Optimization
CMMS tracks actual parts usage per work order — replacing min/max guesswork with demand-driven reorder points. Emergency procurement at 2–3x premium pricing drops as planned work replaces reactive. Documented savings: 18–25% reduction in total MRO spend within 12 months.
Assets maintained on consistent PM schedules last 20–40% longer than run-to-failure equipment. For a facility with $10M in replacement asset value, extending average life by 25% defers $2.5M in capital expenditure over the planning horizon. CMMS condition tracking enables repair-vs-replace decisions based on data, not calendar.
Formula: Total RAV x 25% life extension x annual depreciation rate = deferred CapEx value.
05
Compliance & Risk Avoidance
OSHA serious violations cost $15,000+ per incident in 2026. FDA 483 observations on equipment maintenance can trigger Warning Letters. Insurance premiums decrease 5–15% with documented PM compliance. The compliance ROI is not a savings number — it is a cost-avoidance number that the CFO understands immediately.
Formula: Violations avoided x fine amount + insurance savings + audit preparation time eliminated.
ROI
Total ROI Summary Formula
Add all five categories and divide by annual CMMS cost. Most facilities see 5:1 to 15:1 ROI ratios. The conservative case (downtime reduction alone) typically pays for the CMMS within 3–6 months. The full case (all five categories) delivers returns that make the business case unarguable.
Total ROI = (Downtime + Labor + Parts + Asset Life + Compliance) / Annual CMMS Cost
Build Your Custom ROI Case — With Your Numbers, Not Industry Averages.
OxMaint's deployment team helps you calculate facility-specific savings across all five categories using your actual downtime hours, labor costs, and MRO spend — producing a CFO-ready business case in your first demo session.
Mobile work orders eliminate the walk-back-to-desk workflow on day one. Technicians create and close work orders from their phone. QR asset scanning delivers history in seconds. Approval routing goes digital. Wrench time improvement is measurable within the first two weeks.
Typical Month 1 value: 15–20% of total annual labor savings begin accruing immediately.
Month 2–3
PM Compliance & Downtime Reduction — Building
PM schedules are configured and generating automated work orders. Overdue maintenance backlog is cleared. Equipment that was running without inspection for months gets its first documented PM. The failure rate begins declining as deferred maintenance gets addressed. First downtime savings measurable by month 3.
Typical Month 2–3 value: PM compliance jumps from 60–70% to 90%+. First prevented failures documented.
Month 4–6
Parts Optimization & Full ROI Confirmation
Parts usage data from 3+ months of work orders enables demand-driven reorder point adjustments. Emergency procurement drops as planned work dominates. The full ROI calculation — combining downtime, labor, and parts savings — typically confirms payback by month 4–6 at the latest. Most facilities exceed their initial projections.
Typical Month 4–6 value: Full ROI payback confirmed. 15–30% total maintenance cost reduction documented.
Month 7–12
Asset Life Extension & Compounding Returns
With 6+ months of condition data in the CMMS, repair-vs-replace decisions shift from gut feel to data. Equipment that was scheduled for replacement shows extended life based on documented PM performance. CapEx deferrals enter the ROI calculation. Predictive patterns emerge from work order history, enabling the shift from preventive to predictive maintenance.
Typical Month 7–12 value: Asset life extension savings quantified. Compliance audit costs eliminated. Total ROI typically 5:1–15:1.
"
The facilities that get CMMS budget approved fastest are the ones that present the ROI case in the CFO's language — not "improved efficiency" but "$412,000 in documented savings against an $18,000 annual investment." The CFO does not need to understand PM compliance or wrench time. The CFO needs to see that every dollar spent on CMMS returns $5–$15. Build the case from your own downtime hours and your own labor costs. The industry benchmarks confirm it. Your own numbers close it.
OxMaint Customer Success Analysis
Based on documented outcomes from 1,400+ facility deployments across manufacturing, commercial, and industrial operations
16 days
average payback period for a mid-size manufacturing facility — CMMS cost recovered in under 3 weeks
$0
upfront cost on OxMaint — free trial with no implementation fees, no consultant requirement
5:1–15:1
documented first-year ROI ratio across all facility sizes — conservative calculation methodology
The ROI Case Writes Itself When You Start Tracking.
OxMaint is free to start. No implementation fees. No consultant. Your maintenance data begins building the ROI case from the first work order — downtime tracked, labor hours captured, parts usage logged, PM compliance measured. By month 3, you have the numbers. By month 6, the CFO has the proof.
Labor productivity improvements (wrench time) are measurable in the first 2 weeks. PM compliance and downtime reduction savings appear by month 2–3. Full ROI payback is typically confirmed by month 3–6. The conservative case — downtime savings alone — pays for OxMaint in 16–45 days for a mid-size facility. Parts optimization and asset life extension compound the returns over months 4–12. Start free and begin capturing ROI data from day one.
What if we already use spreadsheets for maintenance tracking?
Spreadsheets create the illusion of tracking without delivering the value. They cannot auto-generate PM schedules, push mobile notifications to technicians, calculate KPIs in real time, or produce audit-ready reports on demand. Facilities switching from spreadsheets to CMMS report 70% reduction in reporting time, 25–40% improvement in PM compliance, and the elimination of lost work orders that spreadsheets cannot prevent. The spreadsheet is costing you more than the CMMS.
How do we calculate our facility's specific ROI?
Three numbers drive 80% of the ROI case: (1) Annual unplanned downtime hours multiplied by hourly production cost, (2) Number of technicians multiplied by fully loaded cost and multiplied by wrench time improvement percentage, (3) Annual MRO spend multiplied by 20% optimization. Add these three and divide by CMMS annual cost. Most facilities see 5:1 to 15:1 ratios. Book a demo and we will build the calculation together using your numbers.
What does OxMaint cost?
OxMaint offers a free trial with no implementation fees and no consultant requirement. Paid plans scale with the number of users and assets. For a mid-size facility with 10–20 maintenance team members, annual cost is typically $12K–$24K — generating $300K–$600K in documented first-year savings. The cost-to-savings ratio makes OxMaint one of the highest-ROI investments a maintenance operation can make. Start free today — no credit card required.