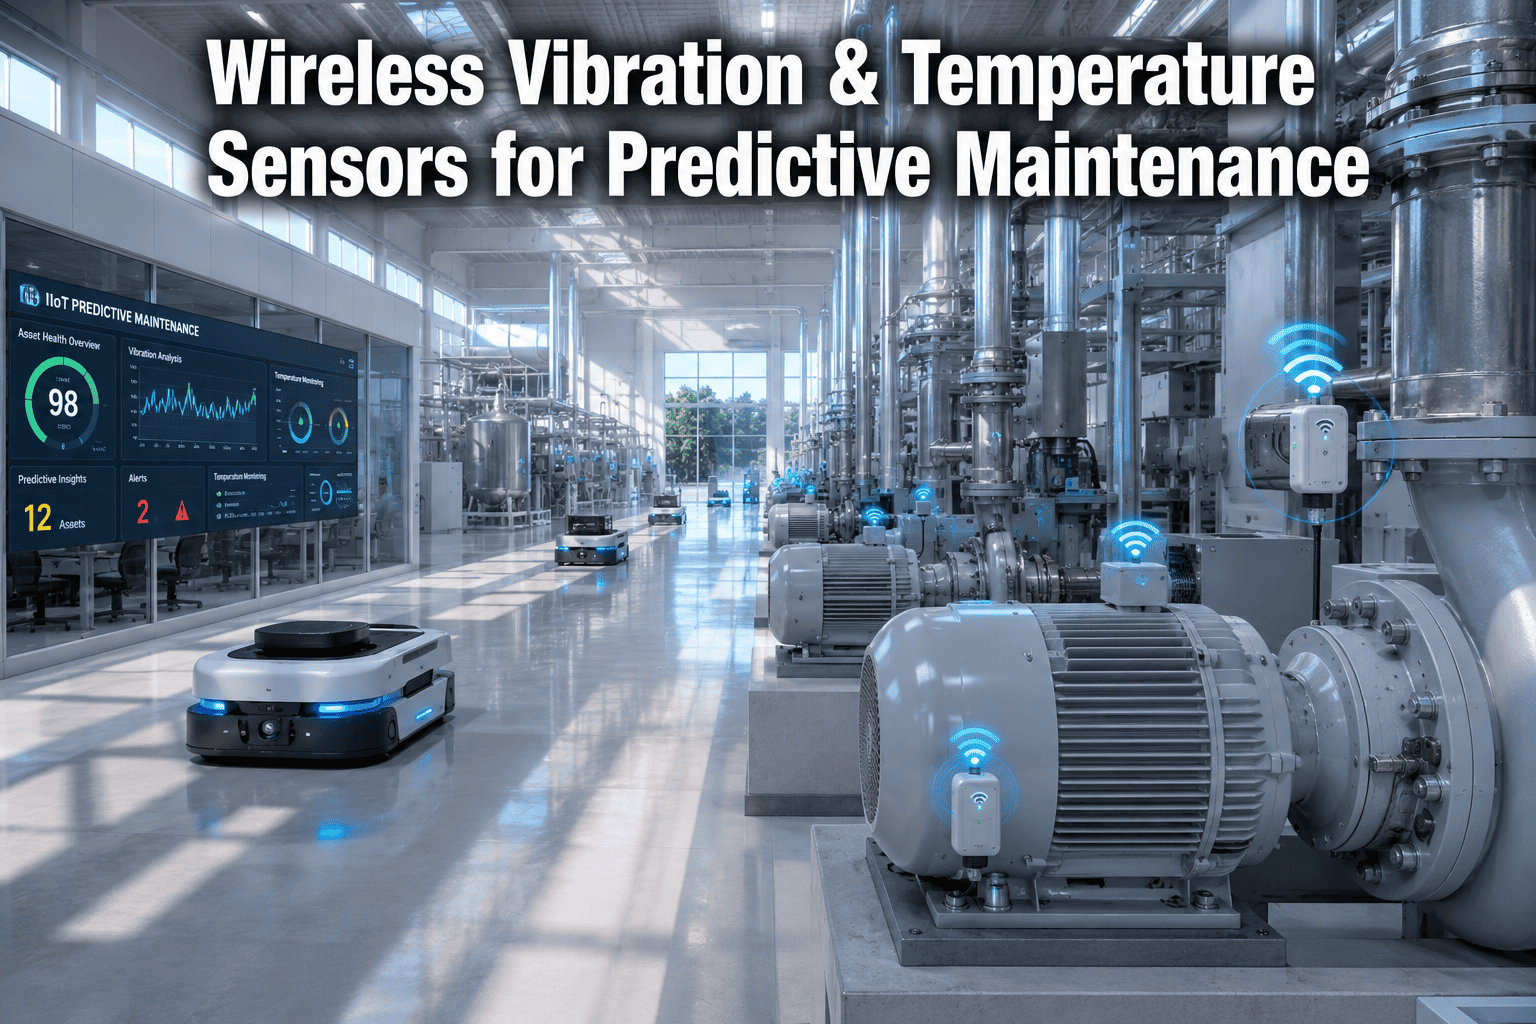
Most industrial facilities run their most critical rotating assets — motors, pumps, fans, gearboxes — with no real-time visibility into machine health. Inspections happen on a schedule, not based on actual condition. By the time a technician notices a bearing running hot or a pump vibrating abnormally, the failure is already hours or days away. Wireless vibration and temperature sensors change that entirely: they deliver continuous condition data from every monitored asset directly into your CMMS, turning reactive emergency repairs into planned, predictable interventions. Facilities that deploy structured sensor-to-CMMS programs report up to 45% reductions in unplanned downtime and 30% lower maintenance spend within the first year — start a free trial to see how Oxmaint connects sensor data to automated work orders, or book a demo and we will walk through your specific rotating equipment portfolio.
Wireless Vibration & Temperature Sensors for Predictive Maintenance
How plug-and-play IIoT sensors on motors, pumps, fans, and gearboxes — integrated with a CMMS — detect bearing failure, misalignment, and thermal anomalies weeks before a breakdown occurs.
reduction in unplanned downtime reported by facilities running continuous vibration monitoring programs
4.8x
higher cost of emergency reactive repairs versus planned maintenance interventions
87%
of bearing failures give detectable vibration signatures 2–8 weeks before catastrophic failure
30%
average maintenance cost reduction within 12 months of deploying a structured IIoT PdM program
What Is Wireless Vibration and Temperature Monitoring?
Wireless vibration and temperature monitoring is the practice of attaching small, battery-powered or self-powered sensors directly to rotating equipment — motors, pumps, fans, gearboxes, compressors — to continuously measure mechanical vibration (in g or mm/s RMS) and surface temperature. These sensors transmit data over industrial wireless protocols (900 MHz, ISA100, WirelessHART) to a local gateway, which forwards readings to a cloud or on-premise platform where condition baselines are established and anomaly thresholds trigger alerts.
The critical word is continuous. Traditional walk-around inspections using handheld vibration meters sample each asset for 30–60 seconds every 1–4 weeks. A bearing that begins degrading on day 2 of a 4-week cycle can fail before the next inspection. Wireless sensors sample every 1–60 minutes, catching developing faults while they are still weeks from failure — giving maintenance teams time to plan, source parts, and schedule a shutdown window rather than scrambling after the breakdown occurs. Teams that make this shift consistently see measurable results within the first 90 days — start a free trial to connect your first sensor to Oxmaint, or book a demo to see how the alert-to-work-order workflow operates on real asset data.
Most facilities lose 20–40% of their maintenance budget to failures that wireless sensors would have predicted 2–6 weeks in advance.
Core Concepts Every Reliability Engineer Must Understand
01
RMS Velocity (mm/s)
The ISO 10816 standard measures overall vibration severity as RMS velocity in mm/s. Values above 4.5 mm/s on general machinery indicate alarm; above 11.2 mm/s signals danger. This is the primary metric for trending asset health.
02
FFT Spectrum Analysis
Fast Fourier Transform decomposes a raw vibration signal into its component frequencies. Bearing defect frequencies, gear mesh frequencies, and imbalance appear as distinct peaks — enabling fault-type identification, not just severity measurement.
03
Bearing Fault Frequencies
Each bearing produces characteristic fault frequencies (BPFO, BPFI, BSF, FTF) calculable from bearing geometry and shaft speed. Monitoring these specific frequencies detects inner race, outer race, ball, and cage defects weeks before failure.
04
Temperature Delta Trending
Absolute surface temperature matters less than rate-of-change. A motor bearing surface rising 8°C above its established baseline in 48 hours signals abnormal friction — often caused by lubrication failure, overload, or developing bearing wear.
05
Wireless Gateway Architecture
Sensors transmit to a local gateway (such as Banner DXM) over 900 MHz or 2.4 GHz. The gateway aggregates readings and forwards via Modbus TCP, Ethernet, or REST API to the CMMS. One gateway typically covers 50–100 sensors across a 300m radius.
06
Condition-Based Maintenance (CbM)
CbM uses actual asset condition data — not a fixed calendar — to trigger maintenance. Work orders are generated when sensor readings cross defined thresholds, ensuring intervention happens when the asset needs it, not before or too late.
07
P-F Interval
The Potential-to-Functional Failure interval is the time between when a defect becomes detectable and when it causes a failure. Vibration monitoring extends the usable P-F interval to weeks, enabling scheduled replacement versus emergency repair.
08
CMMS Auto-Work-Order Triggers
When a sensor alarm fires, the CMMS automatically generates a work order: asset identified, fault type described, priority assigned, technician notified. No manual intervention required — the alert becomes an actionable maintenance task within seconds.
Why Predictive Maintenance Programs Fail Without Sensor Integration
Walk-Around Inspection Gaps
Handheld checks capture a 30-second snapshot every 2–4 weeks. Bearing degradation cycles of 48–96 hours are entirely invisible. Assets fail between inspections and the first sign of trouble is a breakdown, not an alert.
No Baseline, No Trend
Without continuous historical data, a single vibration reading is meaningless. You cannot know if 3.2 mm/s is alarming or normal for a specific asset without 30, 60, or 90 days of trend data showing where it started and which direction it is moving.
Alert Without Action
Many sensor systems generate alerts that go to email inboxes and are never actioned. Without CMMS integration, an alert is just a notification — it becomes a maintenance task only when someone manually creates a work order, which often happens too late.
Siloed Sensor and Maintenance Data
Sensor platforms and CMMS systems rarely speak the same language. Condition data lives in one system, maintenance history in another. Reliability engineers cannot correlate which maintenance events changed vibration signatures without painful manual cross-referencing.
False Alarm Fatigue
Poorly configured thresholds generate dozens of low-priority alerts daily. Technicians learn to ignore them. When a genuine alarm fires, it receives the same dismissal — and the asset fails anyway. Threshold calibration against real baselines is essential.
No CapEx Visibility from Condition Data
Sensor data captures current condition but most platforms do not translate degradation rates into replacement cost forecasts. Maintenance teams cannot answer the question finance asks every year: which assets will require capital replacement in years 3–7 and at what cost.
Operations teams managing 500+ assets without continuous condition monitoring carry an invisible $400K–$1.2M annual risk in undetected failures — start a free trial to quantify yours.
How Oxmaint Turns Sensor Data Into Planned Maintenance
IoT and SCADA Integration Layer
Oxmaint connects to Banner DXM gateways, wireless nodes (Q45, P6, QM30VT), and any Modbus TCP or REST-capable sensor platform. Readings flow directly into the asset record — no manual data entry, no CSV imports.
Automated Work Order Generation
When a sensor reading crosses a configured threshold, Oxmaint automatically creates a work order: asset identified, fault type populated from the alert, priority level set, and the responsible technician notified — all within seconds of the alarm.
Asset Condition Scoring
Each monitored asset carries a live condition score (1–100) derived from sensor trend data, maintenance history, and age. Scores update continuously, giving reliability engineers an at-a-glance portfolio health view across every facility.
OEE Dashboard and Availability KPIs
Track Overall Equipment Effectiveness, MTBF, MTTR, and planned vs unplanned maintenance ratios across your full asset portfolio. Sensor-driven maintenance history feeds directly into OEE calculations — no manual data reconciliation.
Rolling 5–10 Year CapEx Forecasting
Condition score trends feed Oxmaint's CapEx engine, projecting asset replacement costs 5–10 years forward. Finance and operations align on capital budgets backed by real degradation data — not guesswork or age-based assumptions.
Multi-Site Portfolio Visibility
Sensor health, open alerts, and work order status roll up across every property in a single portfolio dashboard. Directors of Facilities and VP Operations see the full picture without calling individual site managers for status updates.
Reactive vs. Condition-Based Maintenance: The Real Cost Gap
Dimension
Reactive Maintenance
Condition-Based Maintenance
Failure Detection
After breakdown — production already stopped
2–8 weeks before failure via vibration trend
Repair Cost
4.8× higher — emergency labor, expedited parts
Planned cost — scheduled crew, stock parts
Secondary Damage
High — failed bearing destroys shaft, housing
Minimal — bearing replaced before cascade failure
Parts Availability
Emergency sourcing — 2–5 day lead time premium
Planned procurement — standard lead time, no premium
Production Impact
Unplanned stoppage — 8–72 hours lost production
Scheduled shutdown window — minimal output loss
CapEx Predictability
Surprise replacements blow annual capital budgets
5–10 year degradation models feed CapEx planning
Safety Risk
Catastrophic failure creates personnel hazard
Controlled intervention — no uncontrolled failure event
Maintenance Planning
No planning possible — always emergency response
Full shutdown scheduling, crew coordination, permits
ROI and Results: What Facilities Report After Deployment
45%
reduction in unplanned downtime
Reported by manufacturing facilities within 12 months of deploying continuous vibration monitoring on critical rotating assets
30%
lower total maintenance spend
Shift from emergency to planned repairs eliminates expedited labor, premium parts, and secondary damage costs that inflate reactive repair budgets
6–9 mo
typical payback period
For facilities with 20+ critical rotating assets, sensor and CMMS deployment costs are recovered within 6–9 months through avoided emergency repairs alone
3.2x
longer asset service life
Assets maintained based on actual condition rather than fixed schedules experience significantly less accumulated damage and extend service life beyond nameplate expectations
What types of assets benefit most from wireless vibration and temperature sensors?
The highest ROI assets are those with rotating components running continuously or near-continuously: electric motors above 5 kW, centrifugal and positive displacement pumps, HVAC and process fans, industrial gearboxes, compressors, and conveyor drive systems. The common factor is a bearing or gear mesh that generates a detectable vibration signature as it degrades. Assets running intermittently or at very low speeds require more careful sensor selection and baseline methodology but can still be monitored effectively with accelerometers rated for low-frequency capture.
How does the Banner DXM gateway integrate with a CMMS like Oxmaint?
The Banner DXM100 controller collects readings from bound Q45 or P6 wireless nodes and can forward data over Modbus TCP/IP, Ethernet I/P, or via REST API calls. Oxmaint's IoT integration layer accepts data over these protocols, maps incoming register values to specific asset records, and applies the configured alarm thresholds. When a threshold is crossed, Oxmaint generates a work order automatically. Setup involves binding sensors to the DXM, configuring the DXM output register map, and pointing the gateway to the Oxmaint API endpoint — most implementations go live within one working day.
How many sensors does a facility typically need to start a PdM program?
Most facilities start with a focused deployment on their 15–25 most critical assets — those where a failure causes the most production loss, safety risk, or repair cost. A single Banner DXM100 gateway can support up to 47 wireless nodes across a 300m radius, so a starter program covering 20 assets typically requires one gateway and 20–40 sensors (two per asset for drive-end and non-drive-end bearing monitoring). This initial deployment generates enough condition data to justify the full program expansion within 6–12 months, usually funding itself from the first avoided failure.
How quickly can a maintenance team deploy wireless sensors and see results in Oxmaint?
Physical sensor installation on standard motors and pumps takes 15–30 minutes per asset — sensors mount magnetically or with adhesive, no wiring required. Gateway commissioning and CMMS integration typically complete within one working day. Baseline establishment takes 2–4 weeks of continuous data collection before alarm thresholds can be confidently set. First actionable alerts typically fire within 30–60 days of deployment. Full program ROI visibility — documented avoided failures and cost comparisons — is usually available within 90–180 days of going live.
Predictive Maintenance Platform
Stop Losing Millions to Failures Your Sensors Could Have Caught
Turn every motor, pump, and fan into a predictable, trackable asset with Oxmaint. Sensor alerts become work orders automatically. Condition scores feed CapEx forecasts. Your entire portfolio — visible from one dashboard.
Real-time asset condition visibility across every site
Predictive failure alerts auto-generating work orders
5–10 year CapEx forecasting from live degradation data
Used by operations teams managing 10,000+ assets. Live in days, not months. No heavy implementation required.