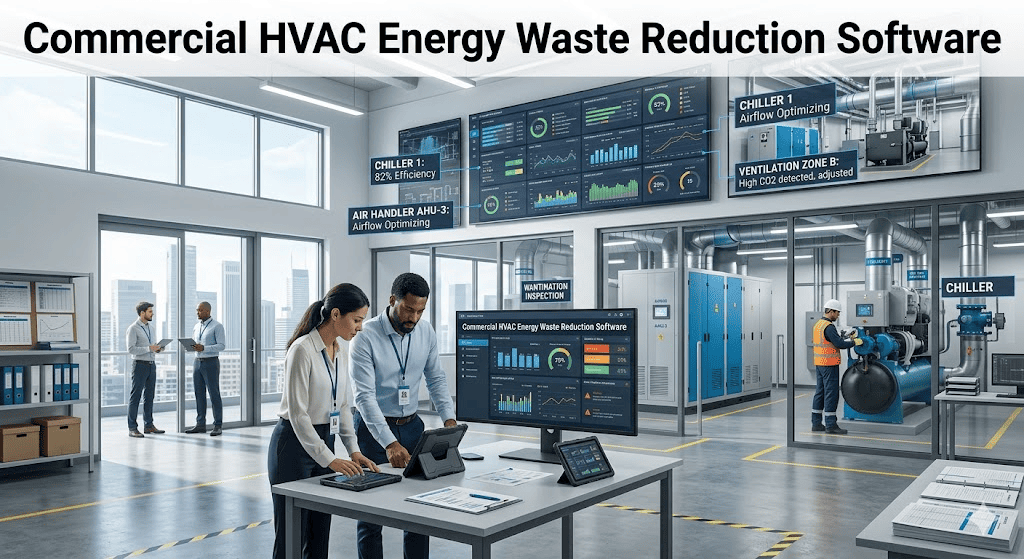
Commercial HVAC systems consume 40% of a typical building's total energy load — and industry studies show 15% to 30% of that energy is wasted through unmaintained equipment, drifted setpoints, fouled coils, and reactive repair cycles. For a 250,000 sq ft Class A office building running four 500-ton chillers and twenty rooftop units, that translates to roughly $312,000 in avoidable annual electricity spend. The fix is not capital replacement — it is structured preventive maintenance combined with continuous performance visibility. Oxmaint connects to your BMS, chiller controllers, and refrigerant logs so every drift, fault, and efficiency drop turns into a tracked work order instead of an unbilled cost. Want to plug the leaks? Start a free trial to centralize HVAC performance tracking, or book a demo to see chiller-level energy attribution on real building data.
CTA · Built for Facility & HVAC Engineering Teams
Stop paying for energy your chillers, AHUs, and rooftop units are quietly wasting.
- Real-time chiller kW/ton and approach temperature monitoring
- Automated PM scheduling tied to runtime hours and BMS faults
- Refrigerant charge, coil cleaning, and filter PD work orders
- Multi-site rollup for portfolios managing 5 to 500 buildings
Live in days · Works with existing BMS · No rip-and-replace
Commercial HVAC Energy Waste Reduction
Eliminate 15% to 30% of HVAC Energy Waste Through Structured Maintenance
Track chiller efficiency, automate coil and filter PMs, and convert BMS alarms into closed-loop work orders across every site in your portfolio.
40%
Of commercial building energy is HVAC load
15-30%
Energy wasted in unmaintained HVAC systems
$312K
Avoidable annual cost in a 250K sq ft Class A office
22%
Average chiller plant savings after structured PM rollout
What Is HVAC Energy Waste Reduction?
HVAC energy waste reduction is the discipline of identifying, quantifying, and eliminating the energy that commercial heating, ventilation, and cooling systems consume beyond what is actually required to deliver design conditions. It sits at the intersection of preventive maintenance, BMS analytics, and operational tuning — and unlike capital retrofits, most of the savings are unlocked at zero hardware cost. The waste hides in five places: drifted setpoints and schedules, fouled coils and filters, low refrigerant charge, simultaneous heating and cooling, and chillers running outside their efficiency sweet spot. Every percentage point of efficiency loss compounds across thousands of equipment-hours per year, which is why a 0.1 kW/ton drift on a 500-ton chiller burns $11,000 in incremental electricity annually.
The discipline matters more in 2026 than ever. Energy-disclosure laws — LL97 in New York, Boulder's BERDO equivalent, UK Building Safety regulations, EU EPBD recast, and California Title 24 reporting — are turning HVAC efficiency from an operating concern into a compliance and asset-valuation issue. Buildings that miss benchmarks pay fines, lose tenants, and see cap-rate compression at sale. Facility teams need a system of record that proves PMs were executed, refrigerant was tracked, and faults were closed within SLA. Want a structured way to capture all of it in one place? Start a free trial or book a demo to walk through a portfolio-grade HVAC maintenance program.
The 6 Energy Waste Vectors in Every Commercial HVAC System
Six waste vectors account for the overwhelming majority of avoidable HVAC energy spend. They appear in every building type — office, retail, healthcare, hospitality, education, mixed-use — and every climate zone. Each compounds on the others, which is why partial fixes deliver disappointing results and why facility teams that switch to structured tracking typically see 20% to 30% reductions in HVAC kWh within the first year. Book a demo if you want a vector-by-vector audit of your own building.
Vector 01
Fouled Coils and Heat Exchangers
Condenser and evaporator coil fouling raises lift, drops capacity, and forces compressors to run longer. Just 0.005-inch of fouling can degrade chiller efficiency by 7% to 12%.
Vector 02
Clogged and Mis-Specified Filters
Filters changed by calendar rather than pressure-drop waste fan energy or get replaced too early. Each 0.5-inch wc of excess PD adds 8% to 10% to AHU fan kW.
Vector 03
Refrigerant Charge Drift
Undercharge or overcharge by even 10% degrades EER by 4% to 20% and accelerates compressor wear. EPA Section 608 logs are rarely tied to performance KPIs.
Vector 04
Setpoint and Schedule Drift
Manual overrides, tenant complaints, and after-hours runtime turn carefully tuned BMS sequences into 24/7 baseload. 70% of audited buildings run HVAC outside scheduled hours.
Vector 05
Simultaneous Heating and Cooling
Reheat coils, dual-duct mixing, and zone fights cause boilers and chillers to fight each other. This single fault can double a building's energy intensity in shoulder seasons.
Vector 06
Chillers Running Off Sweet Spot
Most centrifugal chillers hit best kW/ton between 50% and 75% load. Poor sequencing pushes them into low-load surge or full-load inefficiency, costing 10% to 18% in lift energy.
Vector 07
Belt, Bearing, and VFD Neglect
Slipping belts, dry bearings, and bypassed VFDs quietly add 5% to 15% to fan and pump kW. Vibration trends are rarely captured in maintenance records.
Vector 08
Sensor Drift and Bad Data
A 2°F temperature sensor drift cascades into chilled water reset failures, reheat conflicts, and over-pumping. BMS dashboards look fine — the energy bill tells the truth.
Most commercial buildings burn 15% to 30% of their HVAC electricity on waste that can be eliminated without buying a single piece of equipment.
Why HVAC Energy Waste Persists in Most Commercial Buildings
Facility teams are not unaware of energy waste — they are buried under reactive tickets, paper PMs, disconnected BMS alarms, and refrigerant logs scattered across spreadsheets. By the time a chiller's kW/ton drift is large enough to show on the utility bill, it has already cost the building tens of thousands of dollars. The pain is operational before it is financial, and the root cause is almost always the same: no system of record connecting equipment condition, maintenance history, and energy outcomes. Engineering teams that start a free trial typically uncover six-figure waste streams within the first 30 days of structured tracking.
!
Reactive Repairs Drive Up Energy Cost Silently
Failures get fixed only when tenants complain — by which time chillers and AHUs have already burned weeks of incremental energy. Emergency repairs cost 4.8× more than planned work and tell the team nothing about efficiency drift.
!
BMS Alarms Never Become Work Orders
Modern BMS systems throw thousands of alarms per month. Without an integration layer that converts the meaningful ones into tracked tickets, alarm fatigue sets in and real faults sit unaddressed for weeks.
!
Refrigerant and Compliance Logs Live in Spreadsheets
EPA Section 608, F-Gas, and similar regulations require leak rate tracking and disposal records. Most buildings have them — in 11 separate Excel files no one audits, exposing the owner to fines and lost data.
!
No Equipment-Level Energy Visibility
Utility bills show one number for the whole building. Without chiller-level kW/ton, AHU fan kW, and pump kW attribution, teams cannot tell which asset is bleeding energy or whether a PM actually improved performance.
!
PMs Are Calendar-Based and Disconnected from Runtime
Belts inspected every 6 months whether they ran 2,000 or 8,000 hours. Coils cleaned by calendar instead of by approach temperature drift. Useful PM signal gets lost — and energy waste continues compounding silently.
!
Energy Disclosure Deadlines Create Compliance Risk
LL97, BERDO, EU EPBD, and California Title 24 turn missed benchmarks into fines and tenant retention risk. Without verified maintenance and energy records, owners cannot defend or improve their building's score.
How Oxmaint Eliminates HVAC Energy Waste
Oxmaint connects to your existing BMS, chiller controllers, and IoT sensors and turns every fault, runtime threshold, and condition trigger into a tracked maintenance event. Coil cleaning becomes PD-driven, refrigerant gets logged against EPA Section 608 in the same record, and chiller kW/ton drift triggers a work order before tenants ever feel a temperature swing. Multi-site portfolios get a rollup that ranks every building by HVAC energy intensity — making the worst performers immediately visible to the VP of Operations. Book a demo to see a live portfolio dashboard or start a free trial on one building first.
01
BMS Alarm to Work Order Bridge
Pulls Modbus, BACnet, and API alarms from your BMS and converts the meaningful ones — chiller faults, AHU PD spikes, refrigerant leaks — into prioritized tickets with auto-assigned technicians and SLA clocks.
02
Chiller Performance Tracking
Logs kW/ton, approach temperatures, lift, and load profile per chiller. Trends week-over-week so 0.05 kW/ton drift triggers a coil-cleaning PM long before the utility bill spikes.
03
Condition-Based Filter and Coil PMs
Filter changes triggered by pressure drop sensors instead of calendar dates. Coil cleaning triggered by approach temperature drift. Eliminates both wasted filters and wasted fan energy.
04
Refrigerant Tracking with EPA Compliance
Section 608 charge records, leak rate calculations, and disposal logs in a single audit-ready trail. Auto-flags refrigerant containment as drift exceeds 10% annual leak threshold.
05
Multi-Site Portfolio Rollup
Ranks every building by kWh per sq ft and PM compliance. VP of Operations sees worst-performing assets first; site teams see their own dashboards. One platform, every site.
06
CapEx Forecasting for HVAC Assets
Rolling 5 to 10 year replacement planning tied to actual runtime hours, fault history, and refrigerant phase-out schedules — investor-grade reports for owners and asset managers.
Every $1 invested in structured HVAC maintenance returns $4 to $7 in avoided energy and emergency repair costs within 24 months.
Reactive HVAC Maintenance vs Oxmaint Structured Program
The difference between a reactive HVAC operation and a structured one shows up in every line item — energy bills, refrigerant procurement, emergency call-outs, tenant complaints, and capital reserve forecasts. The table below maps the operational reality side by side.
| Operational Dimension | Reactive HVAC Maintenance | Oxmaint Structured Program |
|---|
| Chiller efficiency monitoring | Spot-checked once a year during PM | kW/ton trended continuously per chiller |
| Filter replacement trigger | Calendar interval (quarterly) | Pressure drop sensor threshold |
| Coil cleaning trigger | Calendar interval (annual) | Approach temperature drift |
| BMS alarm handling | Manual triage in operator console | Auto-converted to prioritized work orders |
| Refrigerant tracking | Paper logs across multiple files | Section 608 audit trail in one record |
| Energy attribution per asset | None — one utility bill for the building | kW per chiller, AHU, pump, cooling tower |
| After-hours runtime detection | Discovered when bill arrives | Real-time schedule deviation alerts |
| CapEx forecasting horizon | Reactive when equipment dies | Rolling 5 to 10 year condition-based plan |
| Compliance disclosure readiness | Manual scramble before deadlines | Continuous audit-ready report exports |
| Annual HVAC energy waste | 15% to 30% of HVAC kWh | Typically cut to 3% to 8% within 12 months |
ROI and Outcomes from Structured HVAC Maintenance
The numbers below come from facility teams that moved from reactive maintenance to a structured Oxmaint program. They represent realistic 12-month outcomes for a single mid-sized commercial building — and they compound across portfolios. Start a free trial to model your own savings on day one.
22%
Average HVAC energy reduction
In year one of structured PM rollout
$210K
Avoided energy spend per building
250K sq ft Class A office benchmark
4.8×
Cost ratio of reactive to planned repairs
Eliminated through PM scheduling
61%
Drop in emergency HVAC call-outs
Within 6 months of go-live
9 mo
Average payback period
Across single and multi-site rollouts
99%
PM compliance rate post-rollout
Compared to 60-70% on paper-based systems
Frequently Asked Questions
How quickly can a facility team see HVAC energy savings after deploying Oxmaint?
Most buildings see measurable savings within the first 60 to 90 days — typically from schedule drift correction, coil and filter PMs catching up, and BMS alarm closure. Full 20% to 30% reduction is normally achieved within 12 months of structured rollout.
Does Oxmaint require ripping out the existing BMS or controls?
No. Oxmaint integrates with existing BMS systems over BACnet, Modbus, and API. It sits on top of your controls layer — pulling alarms and trend data into structured maintenance and energy records without replacing any hardware.
How does Oxmaint handle EPA Section 608 and F-Gas refrigerant compliance?
Every refrigerant addition, recovery, and disposal is logged against the asset record with technician certification, leak rate calculations, and audit-ready export. Annual leak threshold breaches auto-flag for review before regulators ever ask.
Can Oxmaint roll up HVAC performance across a multi-site portfolio?
Yes. The platform is built portfolio-first. Hierarchy runs Portfolio > Property > System > Asset > Component, so VPs see kWh per sq ft and PM compliance across every site while local teams keep their own dashboards.
Cut HVAC Waste · Protect Tenant Comfort · Beat Disclosure Deadlines
Turn HVAC Energy Waste Into a Measurable Line Item — Then Eliminate It
Oxmaint plugs into your BMS, chillers, and refrigerant logs so 15% to 30% of HVAC energy waste becomes visible, trackable, and reducible across every building in your portfolio. Built for facility engineers, VPs of operations, and asset managers who need investor-grade reporting without rip-and-replace deployment. See measurable results in the first 30 days.