Every annual maintenance budget built on gut feel and last year's spreadsheet is wrong before the first invoice arrives. CMMS data for maintenance budget planning changes that entirely — replacing estimates with actual asset cost history, real labor utilization, documented parts consumption, and AI-generated failure forecasts that show you where next year's money will actually go before the fiscal year begins. Facilities that plan their maintenance budgets from CMMS data consistently outperform those that don't: less budget shock, fewer emergency overruns, and maintenance spend that tracks to outcomes rather than arbitrary line items. Book a demo to see exactly how Oxmaint turns your maintenance history into next year's budget.
Turn your maintenance history into a defensible, data-backed budget — in 30 minutes.
- Asset-level cost history for every repair, labor hour, and parts draw
- AI-generated failure forecasts showing where budget will be needed
- Executive-ready reports with KPIs your leadership team will approve
Trusted by 1,000+ facilities across 9 industries · Live in days, not months
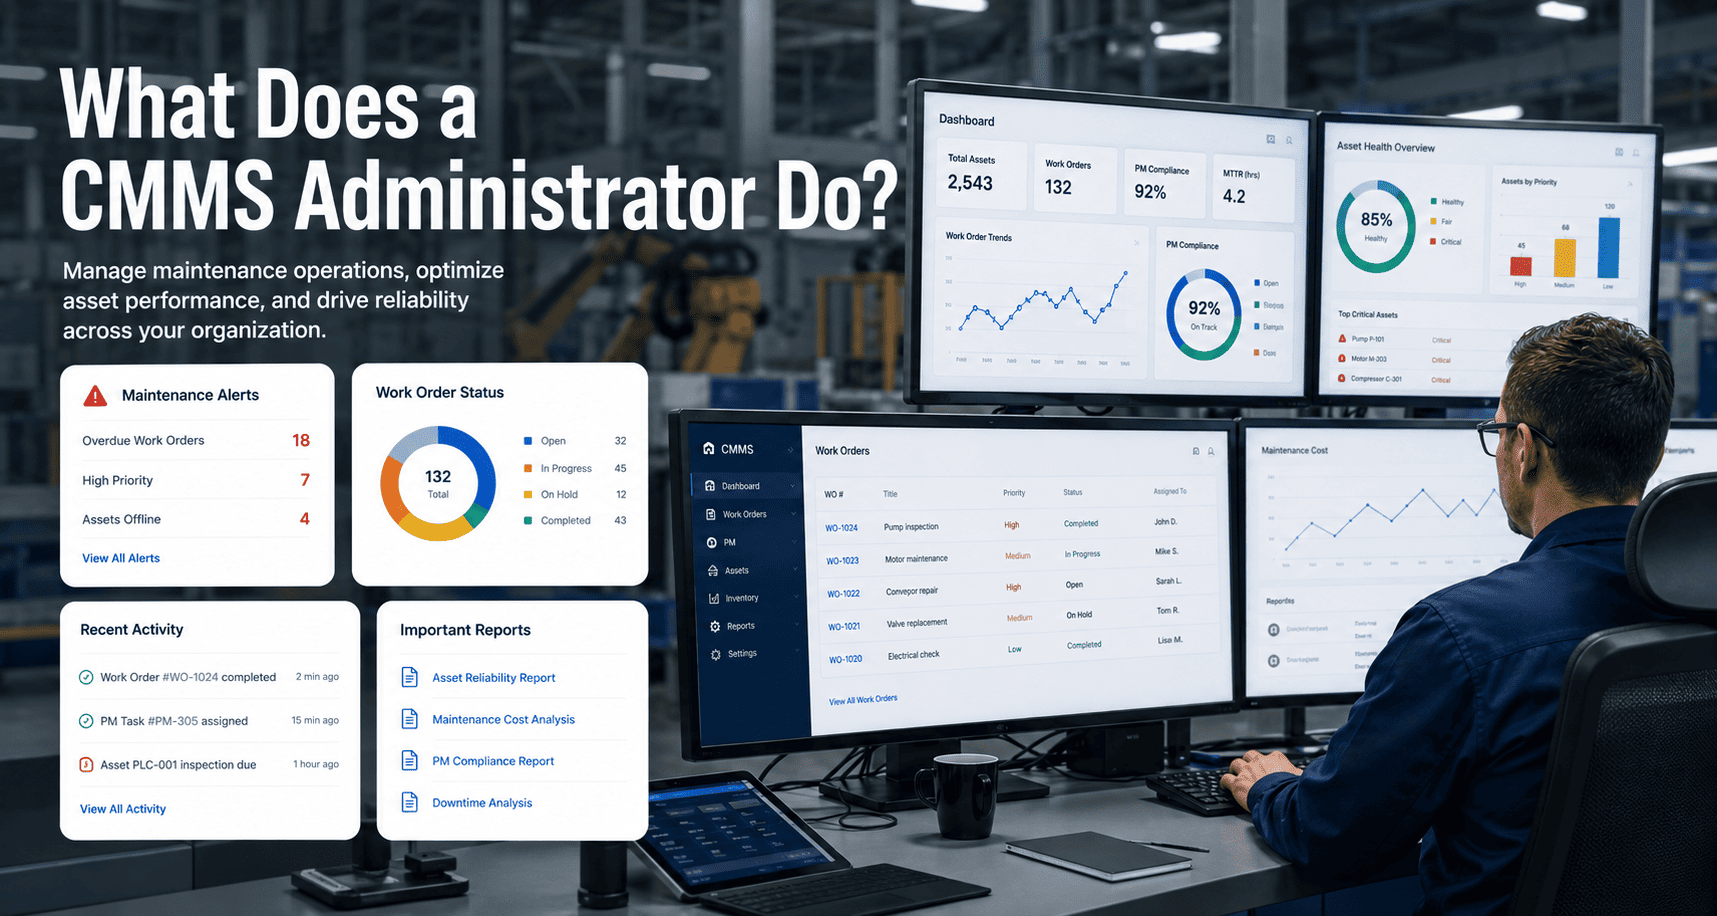
What Is CMMS Data-Driven Maintenance Budget Planning?
CMMS data-driven maintenance budget planning is the process of building your annual maintenance spend forecast from the actual work order records, asset cost histories, labor logs, parts consumption, and AI-generated failure predictions stored in your computerized maintenance management system — rather than from last year's budget plus a percentage guess. Instead of allocating $200,000 to "equipment maintenance" as a category, you arrive at that figure from the bottom up: $42,000 for HVAC system repairs based on documented fault frequency, $31,000 for conveyor line parts based on actual usage, $28,000 for contractor calls based on last year's vendor invoices logged against specific assets.
The shift matters because maintenance budgets built on estimates routinely underfund the assets that are actually deteriorating and overfund equipment that performs reliably. A CMMS closes that gap by surfacing exactly which assets consumed the most budget last year, which ones are trending toward failure based on sensor data, and where your labor hours are going relative to the planned schedule. This precision is what gives maintenance leaders the data to defend a budget to finance, negotiate contractor contracts with evidence, and absorb unexpected costs without blowing through annual allocation. Learn how Oxmaint analytics and reporting surfaces the exact cost intelligence you need for budget season.
The consequences of skipping this are significant. Predictive maintenance powered by CMMS data can reduce maintenance costs up to 25% (Deloitte) — but only if your budget allocates spend to where failures are actually predicted, not where last year's manager happened to focus. Start a free trial and pull your first asset cost report within the first week, or book a demo and we'll show you what that looks like on your data.
The 6 CMMS Data Categories That Build a Defensible Budget
Industry Pain Points: Why Maintenance Budgets Fail Without Data
A single unplanned motor failure on a critical line can wipe out an entire quarter's planned maintenance budget. Without CMMS-driven failure prediction, these events are invisible until they happen — and they happen to the assets your budget didn't prioritize.
Without asset-level cost history in a CMMS, the 20% of assets causing 80% of your maintenance spend are invisible inside aggregate line items. You fund the entire category equally instead of concentrating investment on the actual cost drivers.
When labor budgets are set from headcount rather than work order data, overstaffing on low-demand assets and understaffing during peak failure seasons go undetected until overtime bills arrive. CMMS labor analytics expose both problems before next year's budget is written.
When this year's budget forces PM deferrals, those deferred repairs don't disappear — they accumulate as a hidden liability. U.S. organizations now carry a collective $500B+ in facility maintenance backlogs, most of it created by budgets that cut preventive maintenance without measuring the downstream consequence.
Every one of these failure modes is preventable when your budget is built on CMMS data. Oxmaint's OEE analytics ties maintenance cost data directly to production output — giving you the financial language leadership needs to approve the right budget. Start a free trial or book a demo to see it on your assets.
How Oxmaint Powers Data-Driven Budget Planning
Every closed work order in Oxmaint carries total cost: labor hours, technician rate, parts used, and contractor charges — all tagged to a specific asset. Filter by date range, asset class, location, or failure type to see exactly what each asset cost to maintain last year. This single report replaces months of spreadsheet reconciliation. See how work order tracking builds your cost database.
Oxmaint's labor reports break technician hours into planned PM, reactive repair, inspection, and project work. Seeing that 55% of your labor budget went to reactive repairs tells your budget story better than any narrative — and justifies exactly how much more preventive maintenance investment would reduce that ratio and your total labor spend. Explore preventive maintenance scheduling in Oxmaint.
Oxmaint's parts and inventory module tracks every stock draw against the work order that triggered it. Over a 12-month window, this produces consumption rate per part, cost per asset, and emergency vs. planned purchase ratios. Feed that into next year's budget and you eliminate both stockout-driven downtime and the excess inventory that ties up working capital.
Oxmaint's predictive engine analyzes sensor feeds, runtime data, and historical failure patterns to flag assets showing early degradation. For each at-risk asset, it generates an estimated intervention cost and a projected failure cost — giving your budget a forward-looking view, not just a historical one. This is where predictive maintenance earns its budget line: you spend $4,000 on a bearing replacement you knew was coming instead of $40,000 on an unplanned failure you didn't.
Oxmaint's analytics and reporting module exports budget-ready reports showing maintenance spend by asset, cost category, and work type — alongside KPIs like MTBF, MTTR, PM compliance rate, and OEE impact. These are the numbers your CFO and VP Operations need to approve a maintenance budget without pushback. No more defending requests based on feel; every line item has a source record.
The budget doesn't end when the fiscal year starts. Oxmaint's live dashboards track actual maintenance spend against your approved budget in real time — flagging assets trending over plan before they blow through allocation. Mid-year adjustments become a data conversation, not a political one. Use the Oxmaint ROI calculator to model the impact of shifting budget from reactive to planned maintenance on your facility's specific numbers.
Before vs. After: Maintenance Budget Planning with CMMS Data
| Budget Area | Without CMMS Data | With Oxmaint CMMS Data |
|---|---|---|
| Labor Cost Forecast | Headcount × average rate. No work-type breakdown. Overtime surprises every Q3. | Planned vs. reactive labor split from work order history. Overtime root cause identified and budgeted or eliminated. |
| Parts & Materials | Last year's parts bill + 5% inflation adjustment. No visibility into which parts drove cost. | Per-part consumption rate from 12-month CMMS history. Emergency premiums vs. planned procurement cost split surfaced. |
| Contractor Budget | Estimated from contract values. No asset-level attribution. Surprises from reactive callouts. | Actual vendor spend by asset and job type. Reactive vs. planned outsource ratio flagged for PM investment decision. |
| Equipment Overhauls | OEM recommended intervals applied uniformly. High-use assets under-budgeted, low-use assets over-budgeted. | Asset-specific MTBF trends + AI degradation signals determine which assets need overhaul funding next year. |
| Downtime Contingency | Flat % reserve based on historical average. Never enough when a critical line fails. | Risk-ranked asset list with estimated failure cost. Contingency allocation concentrated on highest-risk, highest-cost assets. |
| PM Program Investment | PM budget set as a category, not justified by downtime cost avoided. | PM ROI calculated per asset: cost of PM vs. documented cost of the failures it prevents. Every PM dollar justified. |
| CapEx Justification | Asset replacement requests based on age and opinion. Finance pushes back without hard data. | CMMS repair history shows total cost of ownership. When cumulative repair cost exceeds replacement cost, data makes the case. |
Maintenance Budget KPIs Oxmaint Tracks Automatically
Benchmarks your total maintenance spend against total asset replacement value. Industry best practice is 2–5%. Above 8% signals over-reactive operations. Oxmaint calculates this in real time, giving you the headline KPI every finance team asks for in budget season.
Percentage of total maintenance hours spent on planned vs. reactive work. World-class: 85%+ planned. Most facilities start at 40–60%. CMMS data shows your current ratio and the budget shift needed to improve it.
Mean Time Between Failures tells you how often each asset type breaks down. Declining MTBF year-over-year is a budget signal: this asset needs more PM investment or is approaching end of economic life.
Average cost per reactive repair vs. average cost per planned PM work order. The ratio (typically 4–8×) is your single strongest argument for shifting maintenance budget from reactive to preventive.
Percentage of scheduled PMs completed on time. Low compliance (industry average: 54%) means your planned maintenance budget is being spent reactively — a direct budget efficiency leak that CMMS data surfaces immediately.
Share of work orders classified as emergency or breakdown. Every percentage point above your target represents budget leakage — emergency work costs 4.8× more than planned work for the same repair scope.
Total value of parts held in inventory relative to annual consumption. Over-stocking ties up capital; under-stocking drives emergency procurement premiums. CMMS consumption data sets the right reorder levels.
How much Overall Equipment Effectiveness is being lost to maintenance-related downtime, and what that translates to in production cost. This is the number that gets maintenance budgets approved — because it speaks the language of revenue, not just cost.
ROI of Building Your Budget on CMMS Data
The ROI case for data-driven budgeting is unambiguous — the only question is which assets are costing you the most money right now. Oxmaint asset management gives you cost-per-asset visibility from day one. Calculate your ROI with our free tool, or book a demo to walk through your actual maintenance spend with our team.
Frequently Asked Questions
What CMMS reports are most useful for annual maintenance budget planning?
The five most budget-critical CMMS reports are: (1) Cost-per-asset report — total maintenance spend per asset over 12 months, ranked highest to lowest; (2) Planned vs. reactive work order ratio — shows where your labor budget is actually going; (3) Parts consumption report — annual parts spend per asset with emergency vs. planned purchase split; (4) Downtime cost analysis — hours of unplanned downtime per asset linked to production loss estimate; and (5) PM compliance rate — the percentage of scheduled preventive maintenance completed on time, which predicts your emergency repair budget for the coming year. Oxmaint's analytics module generates all five as standard reports, exportable for finance review.
How do you use CMMS data to justify a larger maintenance budget to finance?
The most effective approach is to translate maintenance cost into revenue language. Pull your CMMS downtime records and calculate actual production loss per unplanned failure event — hours offline × production rate × revenue per unit. Then pull the cost of the PM that would have prevented each failure. When you show a $2,400 PM would have prevented a $38,000 downtime event, the ROI is self-evident. Pair this with your planned maintenance ratio and MTBF trends to show the direction of travel. Oxmaint OEE analytics connects maintenance data to production output automatically, making this calculation instant rather than manual. Facilities that present this data at budget time rarely get cut — those that present line items without context routinely do.
How can predictive maintenance data improve maintenance budget forecasting?
Predictive maintenance data converts your budget from a historical record into a forward-looking forecast. Instead of allocating spend based on what broke last year, Oxmaint's predictive maintenance engine analyzes sensor data — vibration, temperature, runtime — to identify which assets are showing early failure signals right now. Each flagged asset comes with an estimated intervention cost and a projected failure cost. Aggregate those forecasts across your asset base and you have a data-backed maintenance budget that reflects where money will actually be needed next year, not where it was needed last year. Deloitte research confirms this approach reduces maintenance costs up to 25% compared to calendar-based planning.
What maintenance KPIs should I include in a budget planning report for leadership?
For a budget review with VP Operations or Finance, focus on four KPIs that translate maintenance activity into business impact: (1) Maintenance cost as a percentage of asset replacement value — benchmark against the 2–5% industry standard; (2) Reactive-to-planned ratio — show the current split and the cost reduction if you shift 10 percentage points toward planned; (3) MTBF trend — a declining MTBF on your top 10 assets is a forward-looking budget risk that finance understands; and (4) Downtime cost — actual production revenue lost to unplanned failures, showing what better-funded preventive maintenance would have saved. All four are auto-generated in Oxmaint's dashboard and can be exported to a board-ready format without manual data assembly. Start a free trial and pull your first leadership report this week.
Stop Guessing What Maintenance Will Cost Next Year
Oxmaint turns 12 months of work order history, parts consumption, labor logs, and AI failure predictions into a defensible, asset-level maintenance budget — with the KPIs your finance team needs to approve it without pushback.
- Asset-level cost history and failure forecasts for every budget line item
- Planned vs. reactive split reports that justify PM investment shifts
- Executive-ready analytics exportable for finance and leadership review
Trusted by 1,000+ facilities · 62% less unplanned downtime · 94% AI prediction accuracy · Live in days