Overall Equipment Effectiveness is the single most referenced manufacturing KPI — yet fewer than 20% of plants can break down OEE loss by individual machine, asset class, or loss category with enough granularity to drive targeted improvement actions. The typical OEE report shows a plant-level number (65–72% for most discrete manufacturers) without revealing whether the primary loss driver is availability on the CNC line, performance on the packaging line, or quality on the assembly station. Without machine-level OEE loss decomposition integrated into a CMMS, maintenance and production teams optimise the wrong assets, invest in PM programs that do not address the actual loss drivers, and miss the 15–25% OEE improvement opportunity that comes from targeting the specific machines and failure modes that generate the largest losses. OxMaint CMMS gives manufacturing teams the machine-level OEE loss visibility they need — linking downtime events, speed losses, and quality defects to specific assets, failure modes, and maintenance histories so every improvement action targets the actual loss driver.
OEE Loss Breakdown by Machine and Asset Class
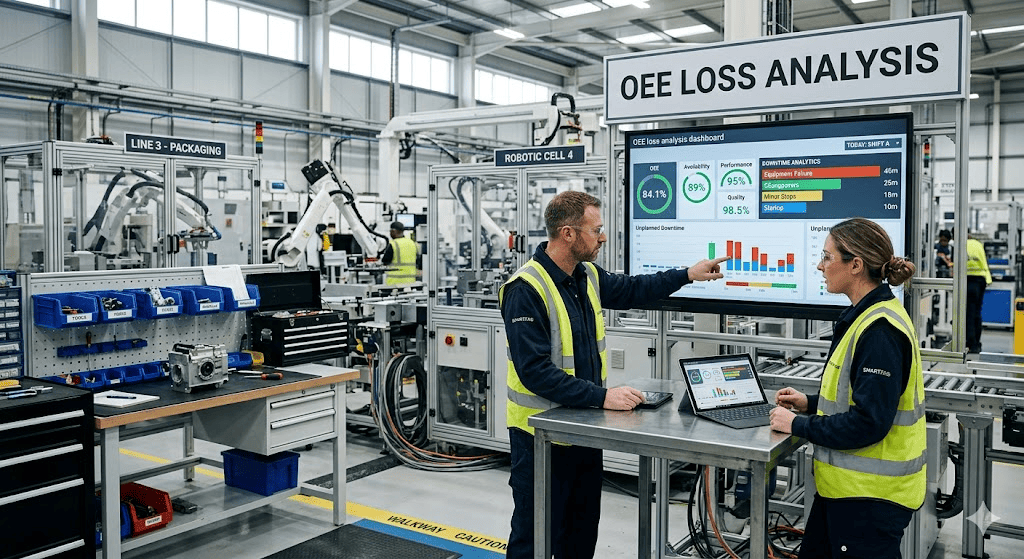
Decompose OEE losses by individual machine, asset class, and loss category to target improvement actions at the specific assets and failure modes generating the largest production losses.
What Is OEE Loss Decomposition by Machine and Asset Class
OEE loss decomposition is the analytical practice of breaking the three OEE components — availability, performance, and quality — down to the individual machine level and further decomposing each component into its contributing loss categories: unplanned downtime, planned stops, minor stoppages, reduced speed, startup rejects, and production defects. The purpose is to identify which specific machines and which specific loss types contribute the most to overall OEE loss — so improvement resources target the highest-impact areas rather than distributing effort evenly across all equipment.
When OEE loss decomposition is integrated with CMMS, maintenance-addressable losses become directly actionable. A machine showing high availability loss links to its CMMS work order history, revealing whether the losses are driven by bearing failures, pneumatic leaks, or control faults — each requiring different maintenance interventions. This closes the gap between OEE reporting (which tells you what is lost) and maintenance action (which addresses why it is lost). Plants that implement CMMS-integrated OEE decomposition report 12–18% OEE improvement within 12 months by focusing on the top 5 loss machines. Start a free trial to see how Oxmaint links OEE loss data to machine work order histories, or book a demo for a walkthrough of OEE loss dashboards by asset class.
6 Elements of CMMS-Integrated OEE Loss Analysis
Track planned and unplanned downtime events at the individual machine level, linked to CMMS work orders. Every downtime event has a documented cause, duration, and maintenance response — enabling loss Pareto analysis by machine and failure mode.
Classify performance losses as minor stoppages or reduced speed, attributed to specific machines. CMMS condition data reveals whether speed losses correlate with equipment age, PM compliance, or specific component degradation patterns.
Link quality defect events to the specific machine and maintenance condition at the time of the defect. CMMS data shows whether quality losses increase after PM deferrals, component replacements, or changeover events — closing the quality-to-maintenance feedback loop.
Compare OEE performance across machines of the same asset class — CNC centres, injection moulders, packaging lines. Machines of the same type with different OEE scores reveal maintenance programme effectiveness differences that can be standardised across the fleet.
Every OEE loss event links directly to the CMMS work order that addressed it. Maintenance engineers see the complete chain from loss event to root cause to corrective action — and whether the corrective action actually prevented recurrence.
CMMS tracks the impact of specific maintenance improvement actions on OEE at the machine level. PM frequency changes, component upgrades, and condition monitoring additions are measured against before-and-after OEE performance for each treated machine.
4 Pain Points in Plant-Level OEE Reporting
Plant-level OEE averages hide the fact that the majority of total loss is generated by a small fraction of machines. Resources are distributed evenly across all equipment instead of concentrated on the machines where improvement generates the largest output gain per dollar invested.
OEE reports show downtime hours but not the maintenance work orders, failure modes, or equipment conditions that caused them. Maintenance teams know a machine lost 40 hours last month but cannot determine whether bearing wear, pneumatic leaks, or control faults drove it without manually cross-referencing separate systems.
Most plants track availability reasonably well but have poor visibility into performance (speed) and quality losses at the machine level. These hidden losses often represent 15–25% of total OEE loss — invisible in reports but visible in output shortfalls, overtime, and customer complaints.
When maintenance teams implement improvements — upgraded components, adjusted PM frequency, added condition monitoring — there is no structured mechanism to measure before-and-after OEE impact at the machine level. Improvement programmes cannot demonstrate ROI. Teams ready to fix this can start a free trial today.
How Oxmaint Delivers Machine-Level OEE Loss Visibility
See OEE availability, performance, and quality scores for every machine in the plant — ranked by loss contribution. Identify the top 5 loss-driving machines instantly and drill into their specific loss categories and maintenance histories.
Every OEE loss event links to the CMMS work order that documented the cause and corrective action. Downtime becomes actionable intelligence — a traced chain from loss to root cause to resolution and recurrence prevention.
Compare OEE across machines of the same type to identify maintenance programme gaps. If one CNC centre runs at 78% OEE and an identical machine runs at 62%, the maintenance history explains why — and the fix can be replicated.
Rank loss contributors by failure mode across the entire machine fleet. CMMS data reveals whether bearing failures, electrical faults, or pneumatic issues drive the largest OEE losses — directing investment to the highest-impact failure mode.
Measure the OEE impact of specific maintenance actions at the machine level. Component upgrades, PM frequency changes, and condition monitoring additions tracked against OEE performance before and after implementation.
Operations directors managing multiple sites see OEE performance and loss breakdowns across all plants from a single dashboard — enabling cross-plant benchmarking that identifies replicable maintenance best practices.
Plant-Level OEE vs Machine-Level CMMS Analytics — Before and After
| OEE Analysis Factor | Plant-Level OEE Only (Before) | Machine-Level CMMS Integration (After) |
|---|---|---|
| Loss Driver Visibility | Plant average only. Top loss-driving machines hidden in aggregate. Resources spread evenly across all equipment. | Machine-level breakdown. Top 5 loss contributors identified with specific loss categories and maintenance root causes. |
| Maintenance Actionability | OEE shows downtime hours — not the failure modes, work orders, or equipment conditions that caused them. | Every loss event linked to a CMMS work order with cause, corrective action, and recurrence tracking. |
| Performance and Quality Tracking | Availability tracked. Performance and quality losses untracked or estimated — hiding 15–25% of total OEE loss. | All three OEE components tracked at machine level with maintenance correlation data for each loss category. |
| Improvement ROI Measurement | No before-after measurement. Improvement programmes cannot demonstrate machine-level OEE impact or ROI. | Machine-level OEE tracked before and after every improvement action. ROI demonstrated per intervention. |
| Annual OEE Improvement Rate | 1–3% annual improvement typical — actions unfocused and unmeasured across all equipment equally. | 12–18% OEE improvement by targeting top 5 loss-contributing machines with data-driven maintenance programmes. |
ROI and Results — CMMS-Integrated OEE Loss Analysis
Frequently Asked Questions
How does Oxmaint calculate machine-level OEE from CMMS work order data?
Can Oxmaint integrate with existing MES or SCADA systems for real-time OEE data?
How does CMMS identify which OEE losses are maintenance-addressable vs production-driven?
What is a realistic timeline for OEE improvement from CMMS-integrated loss analysis?
Stop Guessing Where Your OEE Losses Are — See Them by Machine
Plant-level OEE hides the machines and failure modes driving your losses. Oxmaint gives manufacturing teams machine-level OEE decomposition linked to CMMS work order data — so every improvement action targets the actual loss driver, not the average.
Used by operations teams managing complex manufacturing portfolios. See measurable results in the first 60 days.