Most maintenance teams still discover equipment failures after they happen. Work orders raised when the pump stops. Technicians dispatched when the conveyor jams. Replacement parts ordered when the motor burns out. Research from Aberdeen Group shows that organizations with mature preventive maintenance programs achieve 40-70% higher Mean Time Between Failure than those relying on reactive approaches — but the gap is not about having more technicians or newer equipment. It is about whether your CMMS calculates MTBF automatically from work order data, flags declining reliability trends before failures escalate, and connects condition monitoring insights to the preventive maintenance schedule that stops breakdowns. Start a free trial to see how OxMaint tracks MTBF per asset class and triggers PM adjustments when reliability patterns shift.
OxMaint calculates Mean Time Between Failure automatically from every work order your team closes — updated in real time, per asset class, with declining trend alerts before failures escalate. No manual entry, no spreadsheet consolidation, no reporting lag. If you want to see how automated MTBF tracking transforms reliability management, start a free trial or book a demo.
Mean Time Between Failure measures the average operational time between equipment breakdowns for repairable systems. It is a reliability metric that tells you how long an asset typically runs before requiring unplanned corrective maintenance. A pump with an MTBF of 1,200 hours operates roughly 1,200 hours between failures — whether that failure is a bearing seizure, seal leak, or motor burnout.
MTBF differs from uptime. Uptime measures total time equipment is available to run, including scheduled maintenance windows. MTBF measures only the operating time between unplanned failures. An asset can have 95% uptime but poor MTBF if preventive maintenance is excellent but reactive failures are frequent and disruptive. Understanding the difference helps maintenance teams optimize both planned maintenance schedules and failure prevention strategies — and that distinction becomes actionable when your CMMS tracks both metrics automatically from work order data. To learn more about how tracking both metrics together improves decision-making, book a demo.
PM compliance below 85% correlates with measurable MTBF reduction within 60 days. Missed lubrication, skipped inspections, and deferred PMs appear as declining MTBF trends 4-8 weeks before failures escalate. Organizations with mature PM programs achieve 40-70% higher MTBF than reactive teams.
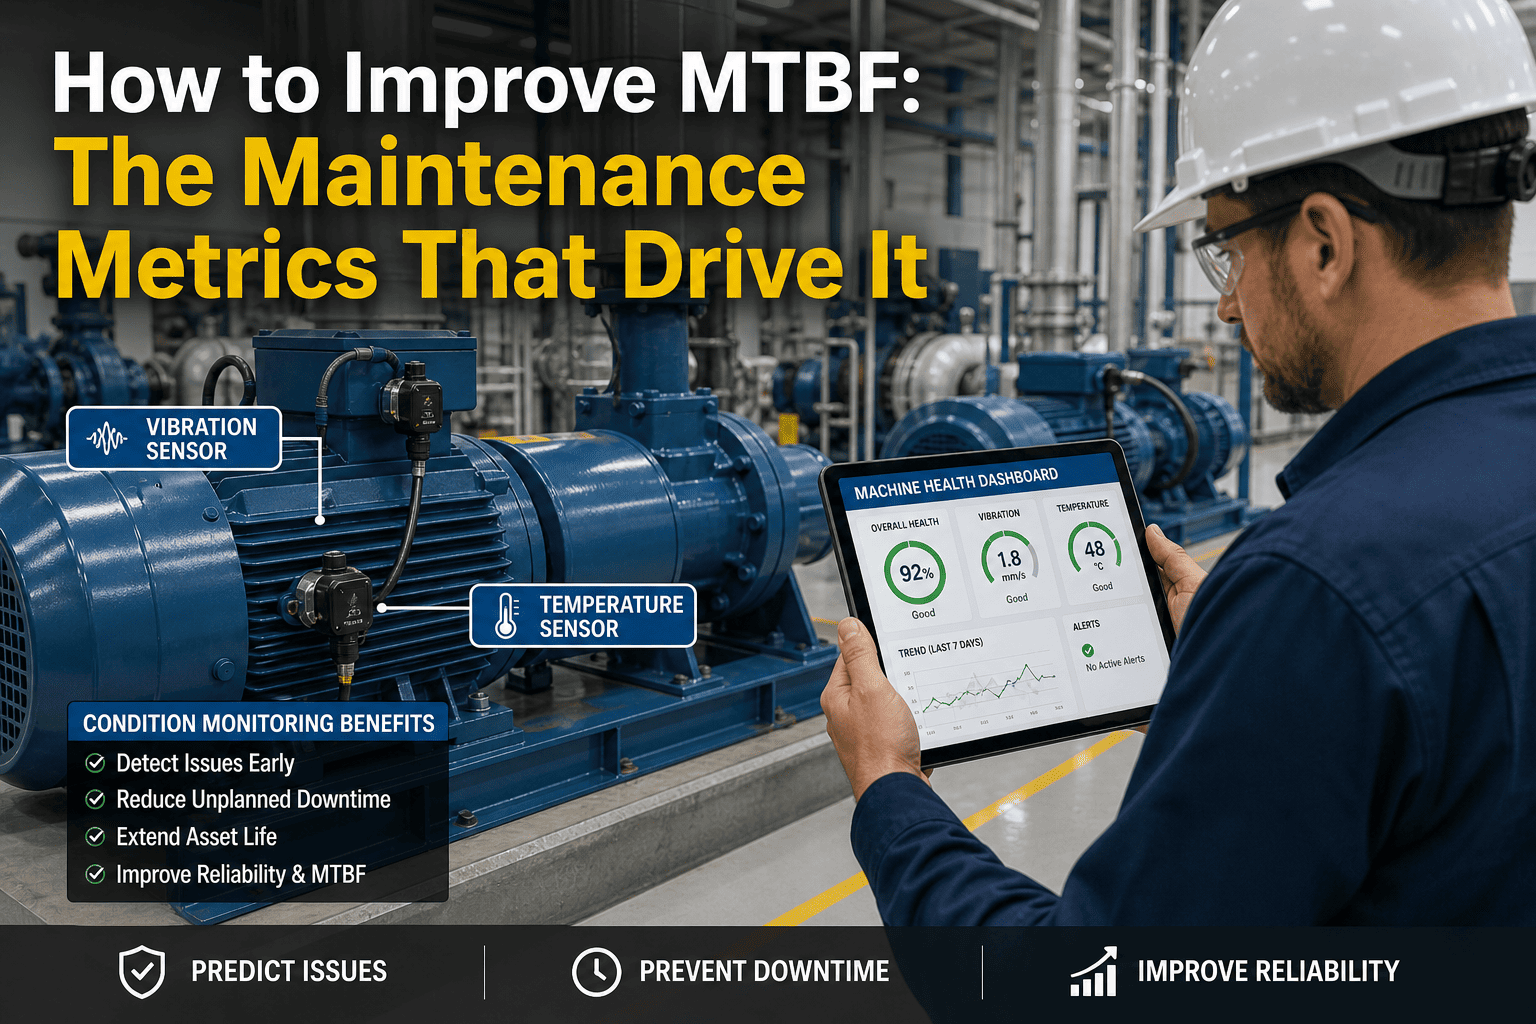
Vibration analysis, thermography, and oil analysis detect degradation before failure. Condition-based triggers shift maintenance from calendar schedules to actual asset health. Plants report 20-35% MTBF improvement when condition monitoring is integrated with CMMS-triggered work orders.
Low-cost aftermarket parts reduce MTBF by 30-60% compared to OEM components. A bearing that saves 500 dollars but reduces MTBF from 2,000 to 1,200 hours costs far more in additional downtime and repeat failures than the upfront savings.
80% of MTBF improvement comes from eliminating recurring failures. When the same asset generates a second work order within 30 days, RCA should trigger automatically. Fixing the top 5 failure modes by frequency delivers more reliability gain than addressing 20 rare events.
Equipment run outside design parameters — excessive speed, improper loading, skipped warm-up cycles — experiences 25-40% lower MTBF. Operator training and digital checklists ensure assets operate within specifications that maximize reliability.
Temperature extremes, contamination, humidity, and vibration shorten asset life. Improved cooling systems, air filtration, and environmental monitoring reduce thermal stress and contamination-related failures that drive down MTBF.
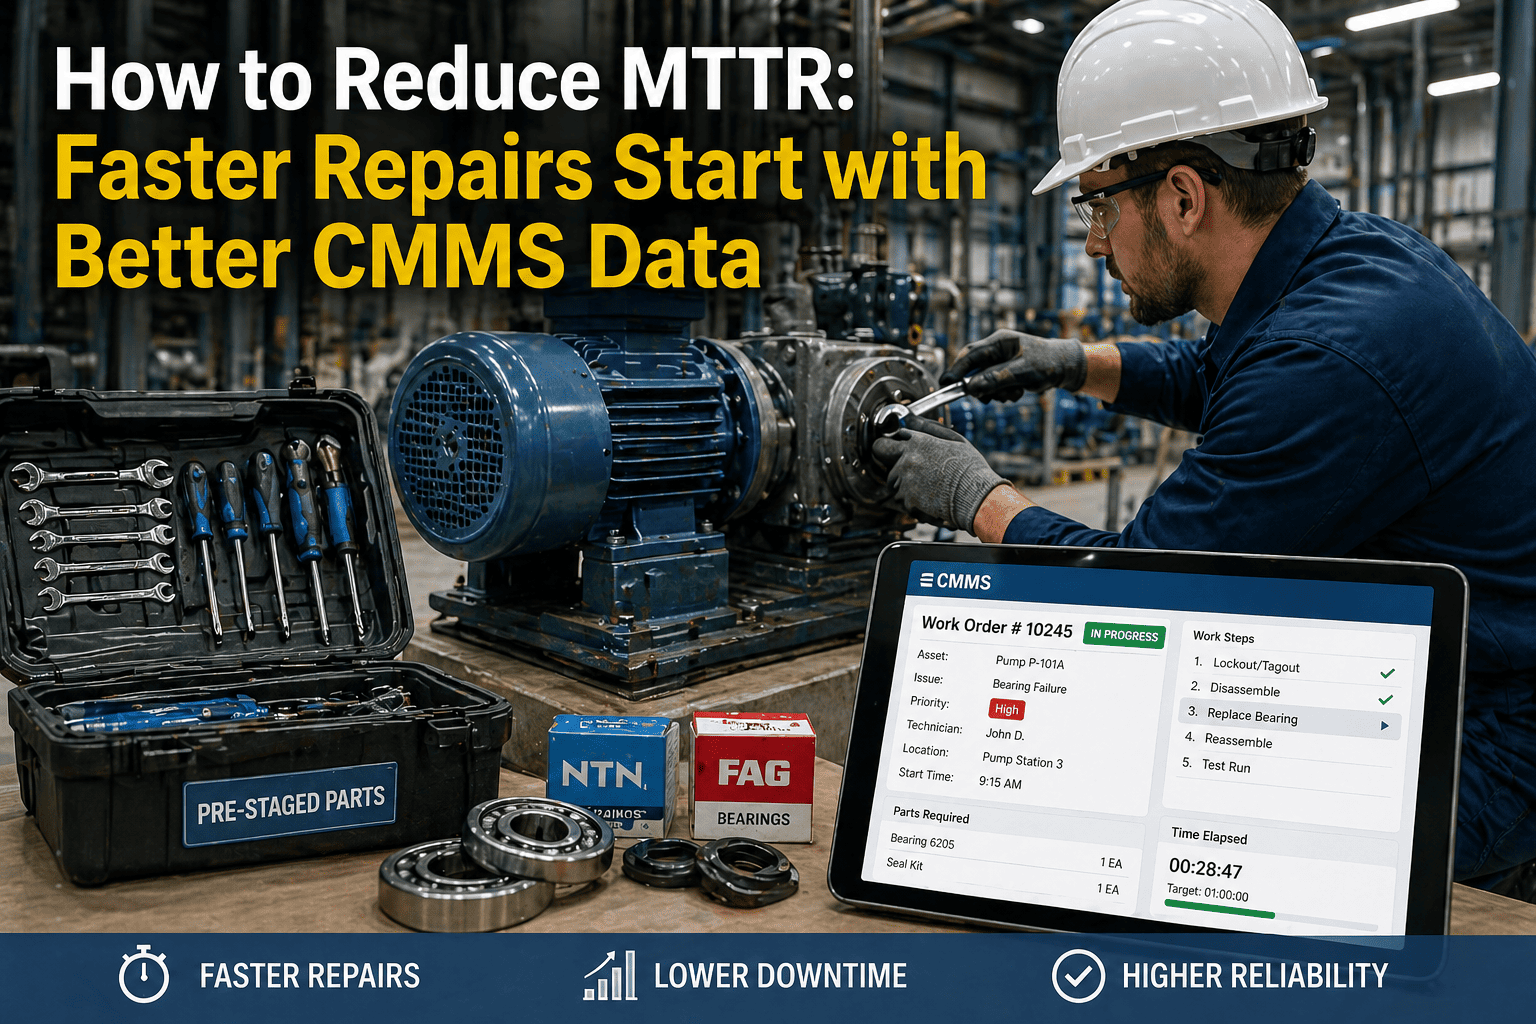
Unplanned failures trigger rush parts orders, overtime labor, and production stoppages. A bearing replacement that costs 800 dollars as planned maintenance escalates to 3,840 dollars as an emergency repair — before accounting for lost production revenue.
Each reactive work order consumes technician hours that should go to preventive maintenance. Below 60% planned maintenance percentage means the team is primarily reactive — each failure crowds out the PM that would have prevented next week's breakdown.
A single failed pump forces connected equipment to run harder. One breakdown creates thermal stress, vibration, and load imbalances that reduce MTBF across the entire production line. Declining MTBF in one asset class predicts failures in dependent systems.
Most calculated MTBF figures are off by 1.5x to 3x because input data is bad. Operator stoppages counted as failures, repeat failures double-counted, and unrecorded failures all skew MTBF calculations. Without clean work order data, MTBF improvement efforts optimize the wrong targets.
OxMaint calculates MTBF automatically from every closed work order — updated in real time, per asset class, with no manual entry. Pumps, motors, conveyors, and HVAC systems each have separate MTBF tracking so reliability trends are visible at the granularity that drives action.
When an asset class MTBF drops 10% or more compared to baseline, OxMaint flags the decline on the reliability dashboard. Declining MTBF is the earliest warning that PM schedules need adjustment — visible 4-8 weeks before failure rates spike.
Any asset generating a second unplanned work order within 30 days gets flagged automatically. The repeat failure indicator triggers root cause analysis before the third occurrence — eliminating recurring breakdowns that drive down MTBF.
PM compliance below 85% correlates with MTBF reduction within 60 days. OxMaint tracks PM adherence per asset class and shows the correlation between missed PMs and declining reliability — making the case for schedule adherence with quantified impact data.
IoT sensor data from vibration, temperature, and oil analysis feeds directly into OxMaint. When sensor thresholds are exceeded, condition-based work orders generate automatically — shifting from calendar-based PM to health-based intervention that improves MTBF by 20-35%.
OxMaint shows cumulative frequency and downtime hours per failure code per asset class. The Pareto view reveals whether bearing failures on pumps are a systemic issue or isolated events — directing RCA and PM adjustments to the failure modes driving 80% of downtime.
| Capability | Reactive Approach | OxMaint CMMS |
|---|---|---|
| MTBF tracking | Calculated manually monthly or quarterly — often inaccurate due to bad input data | Auto-calculated per asset class from every closed work order — updates in real time |
| Declining trend detection | Discovered after failure rates spike — too late to prevent impact | Automatic alerts when MTBF drops 10% — visible 4-8 weeks before failures escalate |
| PM compliance impact | PM slippage noticed at annual audit — cannot connect to reliability degradation | Live PM compliance tracking with MTBF correlation — quantifies impact of missed PMs |
| Repeat failure response | Noticed when third work order is raised — pattern already established | Auto-flagged on second occurrence within 30 days — RCA triggered before pattern persists |
| Condition monitoring | Sensor data in separate system — no connection to work order generation | IoT sensor thresholds trigger condition-based work orders automatically |
| Failure mode analysis | Compiled from spreadsheets quarterly — too aggregated to drive action | Live Pareto view by asset class — shows top failure modes by frequency and downtime |
Average pump MTBF improvement within 12 months of implementing condition-based PM triggers and repeat failure RCA protocols
Worthington Steel prevented 48 hours of unplanned downtime through vibration sensor alert integrated with CMMS work order generation
Time between PM compliance drop and measurable MTBF reduction — the intervention window that prevents failure escalation
Worthington Steel across 17 facilities using condition monitoring integrated with preventive maintenance scheduling
With condition-based lubrication and vibration monitoring
Premium efficiency motors with thermographic monitoring
Regular belt tension checks and bearing inspections
Refrigerant quality monitoring and compressor maintenance
Oil analysis programs and filter replacement protocols
Vibration analysis and temperature monitoring integration
We were calculating MTBF in spreadsheets from technician notes. The data was three weeks old by the time it reached my desk, and half the failure records were incomplete because technicians logged completion time rather than actual breakdown time. When we deployed OxMaint, MTBF calculation became automatic from work order timestamps — and the declining trend alerts changed everything. We caught a motor MTBF drop on Line 3 four weeks before the failure spike would have hit. Adjusted the PM schedule, added vibration monitoring, and brought MTBF back up 41% in two months. That early warning saved us an estimated 200,000 dollars in emergency repairs and lost production. The difference is not better math — it is better data, visible when it matters.