Equipment failures cost industrial operations 5-20% of productive capacity annually. Reliability engineers transform this chaos into predictability using CMMS data to identify failure patterns before they cascade into costly shutdowns. Data-driven reliability engineering shifts maintenance from firefighting to precision prevention, cutting unplanned downtime by 35-50% while extending asset life by 20-40%. Learn how top reliability engineers leverage CMMS analytics, FMEA frameworks, and RCM methodologies to eliminate high-cost failures and build bulletproof maintenance strategies. Start your free trial to access reliability analytics or book a 30-minute reliability assessment with our team.
Reliability Engineer & CMMS: How Data Eliminates Costly Failures
Discover how reliability engineers use CMMS data, FMEA analysis, RCM strategies, and condition monitoring to identify root causes and eliminate equipment failures before they impact production.
Ready to Build a Data-Driven Reliability Program?
Oxmaint gives reliability engineers the tools to track failure modes, analyze root causes, and predict equipment degradation before it impacts production. Get instant access to FMEA templates, RCM workflows, and condition-based analytics.
What Does a Reliability Engineer Actually Do?
Reliability engineers bridge the gap between reactive maintenance and proactive asset management. Unlike maintenance managers who focus on day-to-day work order execution, reliability engineers analyze failure patterns, optimize maintenance strategies, and build systems that prevent breakdowns before they occur. They transform CMMS data into actionable intelligence that extends equipment life and reduces total cost of ownership by 25-35%.
How CMMS Data Powers Reliability Engineering
A modern CMMS is the foundation of every successful reliability program. Reliability engineers mine work order history, failure codes, parts consumption, and downtime records to spot patterns invisible in spreadsheets. When properly configured, CMMS platforms provide the granular asset-level data needed for FMEA, Weibull analysis, and predictive maintenance optimization.
Oxmaint automates this entire workflow with built-in failure analysis dashboards, RCM templates, and condition monitoring integrations. Start your free trial to see how reliability engineers use real-time data to prevent failures, or book a demo for a personalized walkthrough of reliability analytics features.
FMEA: The Reliability Engineer's Blueprint
Failure Mode and Effects Analysis (FMEA) is the systematic method reliability engineers use to identify potential failures, assess their impact, and prioritize mitigation strategies. CMMS data feeds FMEA by providing historical failure frequencies, severity scores, and detection difficulty ratings.
Severity (S)
Impact of the failure on production, safety, and compliance. A catastrophic failure that halts production scores 9-10.
Occurrence (O)
Frequency of the failure mode based on CMMS historical data. Failures happening monthly score 7-8.
Detection (D)
Likelihood of detecting the failure before it occurs. Hidden failures with no warning signs score 9-10.
RPN Score
Risk Priority Number. Scores above 200 demand immediate reliability improvement action. Oxmaint calculates RPN automatically.
RCM Decision Matrix: Match Maintenance to Asset Criticality
Reliability-Centered Maintenance (RCM) assigns the right maintenance strategy to each asset based on failure consequences and detection feasibility. Not every asset needs predictive monitoring — RCM prevents over-maintenance waste.
| Failure Consequence | Detection Feasibility | Recommended Strategy | CMMS Configuration |
|---|---|---|---|
| Safety / Environmental Risk | Detectable with condition monitoring | Predictive Maintenance (PdM) | Set IoT sensor alerts, vibration thresholds, temp limits |
| High Production Impact | Failure pattern is time-based | Preventive Maintenance (PM) | Schedule PM at 80% of MTBF interval |
| Moderate Downtime Cost | Random failures, no pattern | Run-to-Failure + Stock Spares | Ensure parts inventory, fast repair protocols |
| Hidden Failure (no operational impact until combined fault) | Requires inspection to detect | Failure-Finding (inspection rounds) | Schedule monthly/quarterly inspections via CMMS |
| Low Cost, Non-Critical | Failure is obvious | Reactive Maintenance | Stock spare, replace on failure |
| Catastrophic (safety + production) | Detectable + time-based | Hybrid: PdM + PM | Combine condition alerts with scheduled overhauls |
Source: SAE JA1011 RCM standard. Oxmaint's asset hierarchy supports criticality scoring and automated strategy assignment.
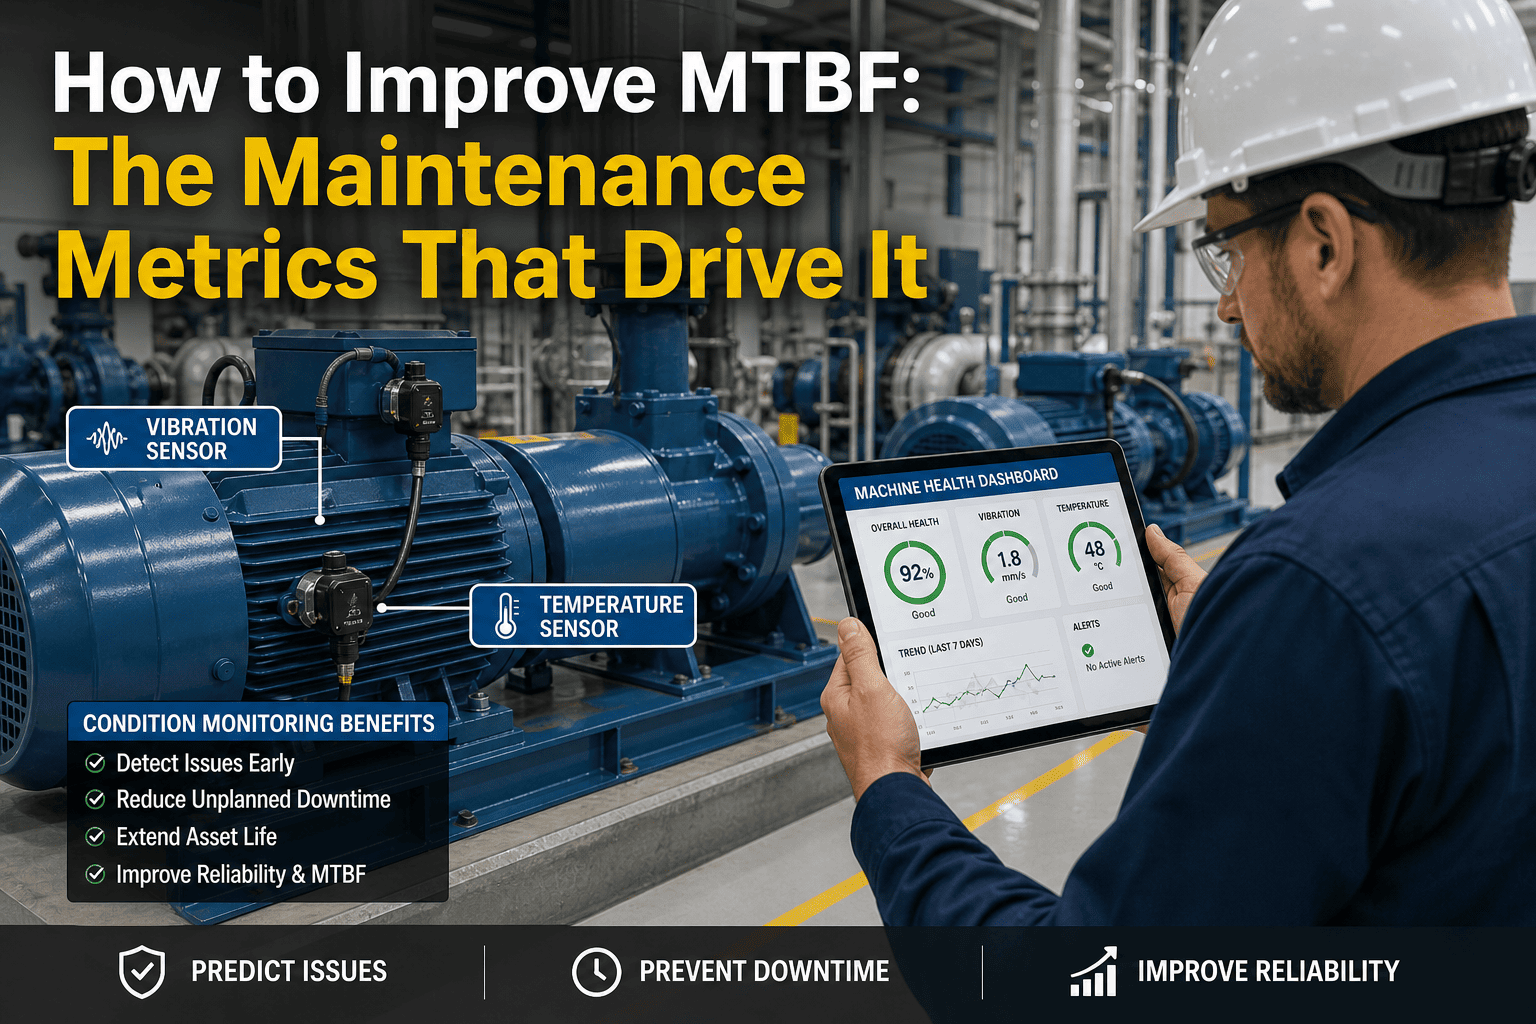
Condition Monitoring: Early Warning System for Failures
Condition monitoring detects degradation before functional failure. Reliability engineers integrate sensor data from vibration analyzers, thermal cameras, oil analysis labs, and ultrasonic detectors directly into CMMS platforms. When a parameter crosses threshold, CMMS auto-generates a work order.
Root Cause Analysis: Stop Repeat Failures
When the same asset fails repeatedly, reliability engineers conduct formal Root Cause Analysis (RCA) to eliminate the underlying problem — not just patch symptoms. CMMS work order history provides the failure timeline and maintenance actions needed for deep-dive investigation.
5 Whys Method
Ask "why" five times to drill from symptom to root cause. Example: Motor failed → Why? Bearing seized → Why? Lubrication depleted → Why? PM interval too long → Why? MTBF data not reviewed → Root cause: No data-driven PM optimization process.
Fishbone Diagram
Map failure contributors across six categories: Man, Machine, Method, Material, Measurement, Environment. Identify which category contains the root cause, then implement controls.
Fault Tree Analysis
Build a logic diagram showing how component failures combine to cause system failure. Quantify probabilities using CMMS failure rate data to prioritize mitigation.
Pareto Chart
Rank failure modes by frequency. The top 3-5 modes typically account for 70-80% of downtime. Focus RCA efforts here for maximum impact.
Oxmaint's failure analysis module auto-generates Pareto charts from work order data and links RCA reports directly to affected assets. Start a free trial to access built-in RCA templates and collaborate with your reliability team in real time, or book a demo to see RCA workflows in action.
How a Packaging Plant Cut Unplanned Downtime 42% in 9 Months
A 340,000 sq ft food packaging facility was experiencing 18-22 hours of unplanned downtime per week across four production lines. Reactive maintenance accounted for 68% of all work orders. The reliability engineer implemented a data-driven approach using CMMS analytics:
- Ran Pareto analysis on 18 months of failure data — identified 6 chronic problem assets responsible for 74% of downtime
- Conducted FMEA on top 6 assets, calculated RPN scores, prioritized 12 high-risk failure modes
- Deployed vibration monitoring on 3 critical conveyors, oil analysis on 2 gearboxes, thermography on electrical panels
- Adjusted PM intervals based on MTBF data — reduced over-maintenance by 22%, added targeted inspections for under-maintained assets
- Trained technicians to log failure codes consistently, achieving 94% data quality within 4 months
Interested in similar results? Book a reliability assessment to identify your highest-impact improvement opportunities.
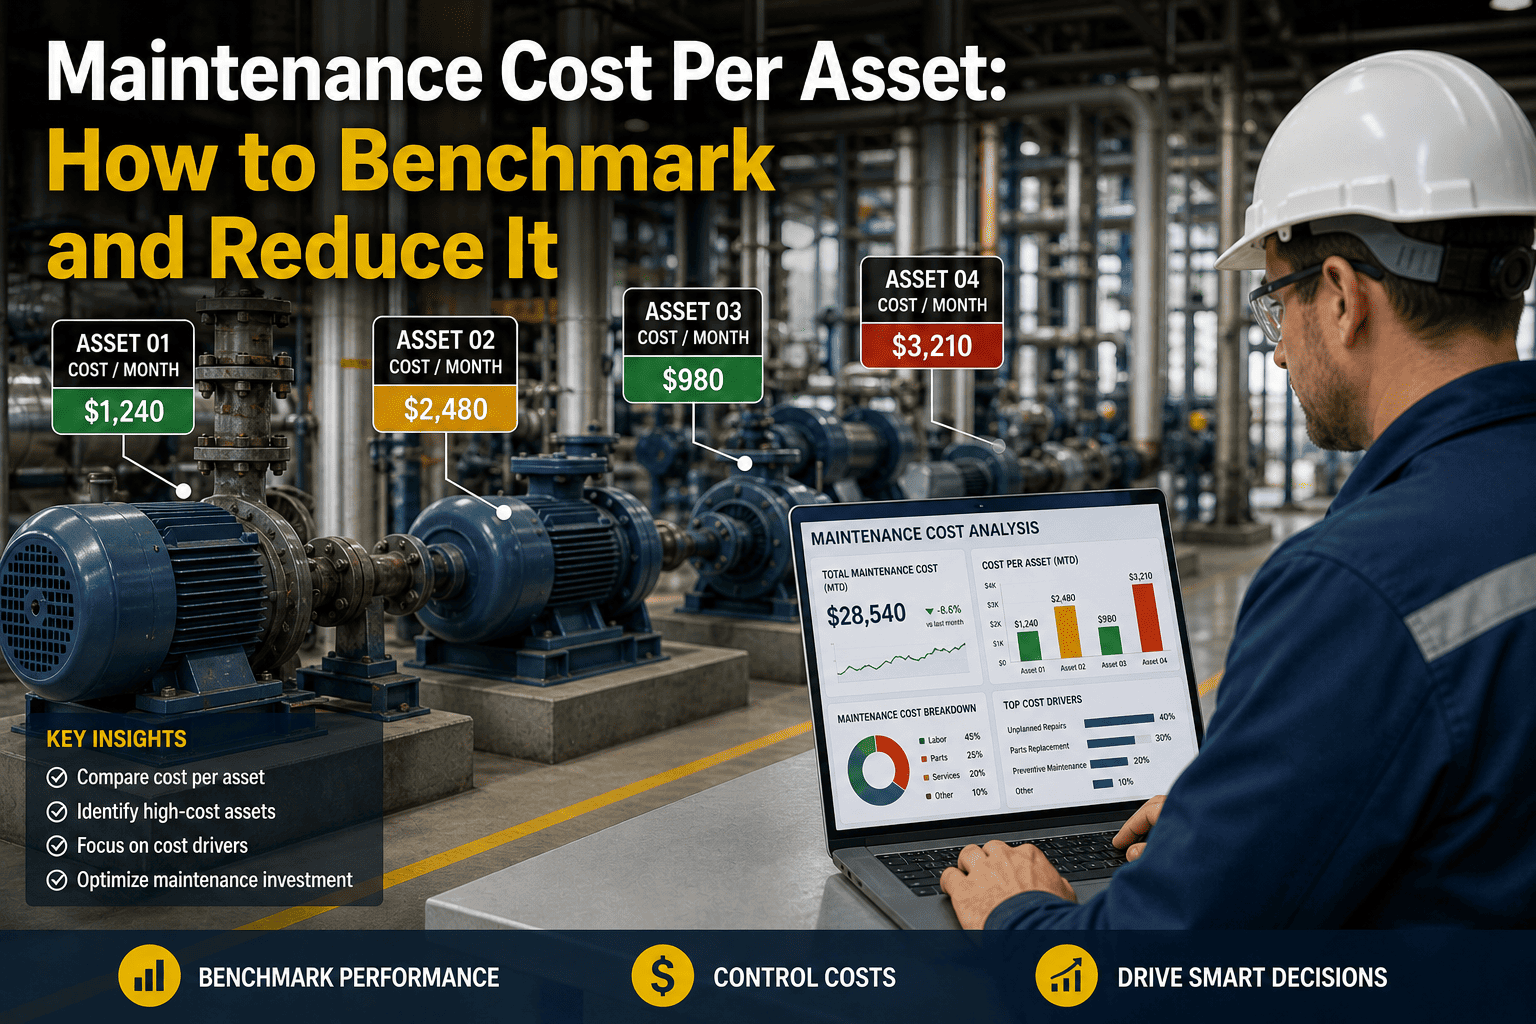
Key Reliability Metrics Tracked in CMMS
Reliability engineers monitor these six KPIs to measure program performance and justify continued investment in proactive maintenance strategies.
Common Reliability Engineering Pitfalls (and How to Avoid Them)
Even experienced reliability engineers fall into these traps when CMMS data quality is poor or organizational buy-in is weak.
Incomplete Failure Data
Technicians skip failure codes or root cause fields, making pattern analysis impossible. Solution: Make failure code fields mandatory in CMMS, train technicians on data importance, audit data quality monthly.
Over-Reliance on OEM Intervals
Blindly following manufacturer PM schedules ignores your actual operating conditions. Solution: Use MTBF data from your CMMS to optimize intervals based on real failure patterns.
Ignoring Low-Frequency, High-Impact Failures
Pareto charts can hide infrequent but catastrophic failure modes. Solution: Run separate analysis for safety-critical and high-cost failures, not just high-frequency events.
Launching Predictive Maintenance Too Broadly
Deploying condition monitoring on every asset wastes budget. Solution: Start with assets scoring highest on FMEA RPN, expand based on ROI data from pilot program.
Frequently Asked Questions
What's the difference between a reliability engineer and a maintenance manager?
How much CMMS data do I need before starting FMEA or RCM?
Can small facilities justify a dedicated reliability engineer?
What ROI should I expect from a reliability engineering program?
How does Oxmaint support reliability engineering workflows?
Should I implement predictive or preventive maintenance first?
Turn Reliability Data Into Failure Prevention
Oxmaint gives reliability engineers a complete platform for FMEA analysis, RCM strategy development, condition monitoring integration, and root cause tracking. Stop reacting to failures — start preventing them with data-driven reliability engineering.