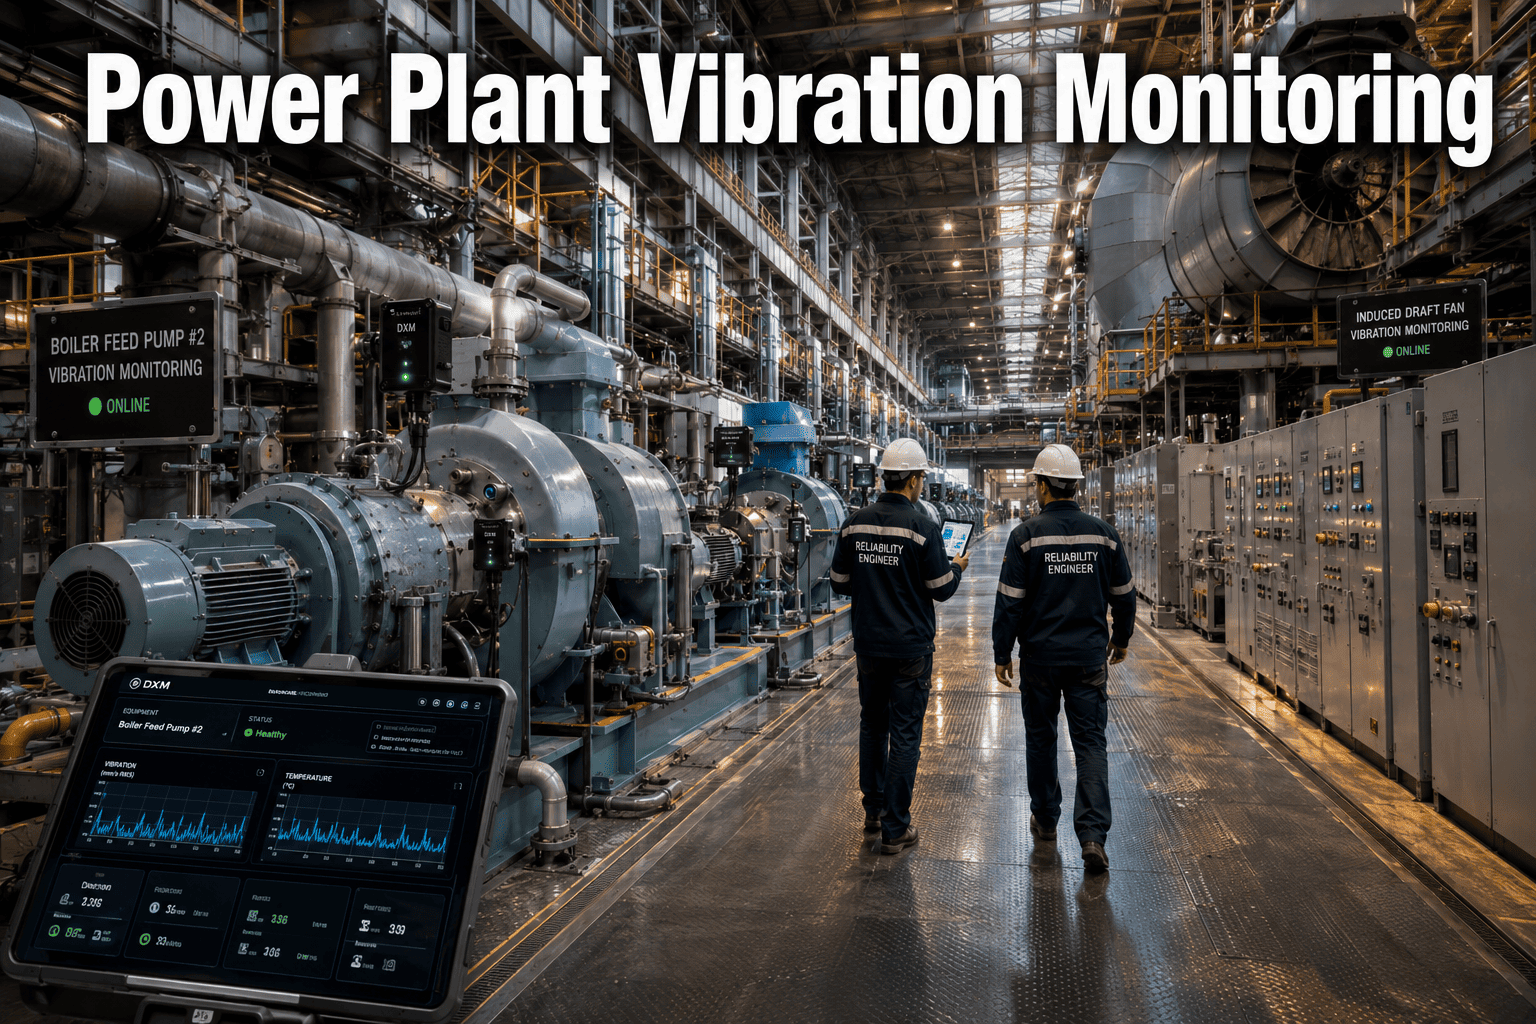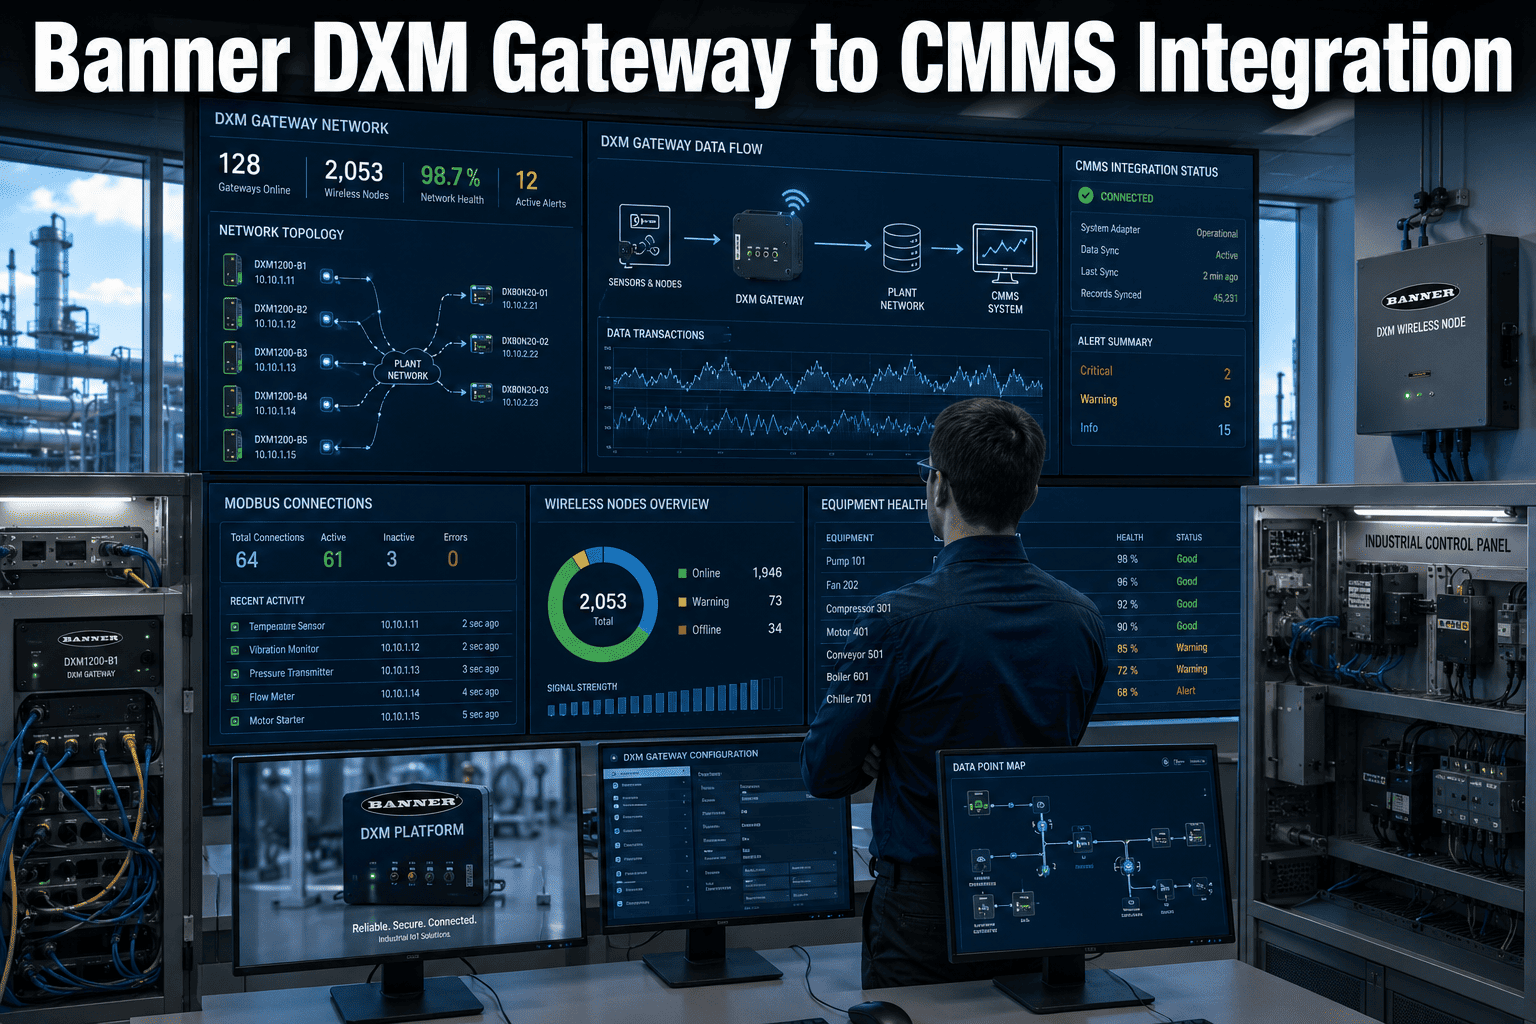
Every wireless vibration and temperature sensor deployed on a motor, pump, or fan is only as useful as the system it feeds. A Banner DXM100 controller can bind dozens of Q45 and P6 wireless nodes, collect readings every few minutes, and store them locally — but if that data never reaches the CMMS, no work orders get generated, no trends get tracked, and no bearing failure gets caught before it happens. The integration gap between sensor gateway and maintenance platform is where most IIoT predictive maintenance programs stall: the hardware is installed, the sensors are running, but the data sits in a gateway log that nobody checks until something fails. This guide covers the complete step-by-step process for connecting Banner DXM gateways to a CMMS over Modbus TCP and Ethernet — so every sensor threshold breach automatically becomes a planned work order in Oxmaint. Start a free trial to connect your first DXM gateway to Oxmaint today, or book a demo and let our integration specialists walk through your exact sensor network configuration.
Banner DXM Gateway to CMMS Integration: Step-by-Step Setup
Complete configuration guide for binding Banner DXM100 controllers, Q45 and P6 wireless nodes to Oxmaint CMMS over Modbus TCP and Ethernet — with register maps, threshold configuration, and auto work-order setup.
What Is a Banner DXM Gateway and Why Does CMMS Integration Matter?
The Banner DXM100 is an industrial wireless controller that acts as the central hub for a network of wireless sensor nodes — QM30VT vibration and temperature sensors, Q45 multi-purpose I/O nodes, and P6 performance nodes. The DXM scans its bound nodes on a configurable interval (typically every 1–5 minutes), stores readings in local registers, and pushes data to external systems via Modbus TCP/IP, Ethernet I/P, or REST API. Out of the box, the DXM is an excellent data collector. The problem is that data collection alone does not prevent failures — only action prevents failures, and action requires a CMMS.
CMMS integration closes the loop: when a DXM register value crosses a configured threshold, the CMMS receives that value, matches it to the correct asset record, applies the alarm logic, and generates a work order automatically. The technician receives a task, not a data stream. This is the difference between a sensor system that generates reports and one that prevents breakdowns. Controls engineers and reliability teams that complete this integration report the sensor investment begins paying back within the first quarter — start a free trial to begin your DXM-to-Oxmaint configuration, or book a demo for a live walkthrough of the integration with our engineering team.
The Four Gaps That Kill DXM-to-CMMS Integration Projects
Most IIoT deployments stall not because of hardware failures but because of integration gaps that were never addressed at commissioning. These are the four patterns that prevent sensor data from ever becoming a planned maintenance action.
DXM gateways assigned dynamic IPs lose connectivity to the CMMS after network restarts. Static IP assignment on a dedicated OT subnet eliminates this and prevents polling gaps that create false data voids in the asset trend history — voids that undermine threshold reliability.
Commissioning engineers bind nodes and configure registers without documenting the final map. Six months later, when an asset is moved or a sensor replaced, nobody knows which register corresponds to which asset — requiring a full re-survey of the sensor network and often invalidating months of trend history.
Teams that apply ISO 10816 limits globally — without asset-specific baseline calibration — generate excessive alerts on assets running at higher-than-typical vibration for legitimate operational reasons. Technicians stop responding to alerts within weeks, and the first genuine alarm gets dismissed with the rest.
Many integrations stop at sending email alerts when thresholds are crossed. Without automated work order creation in the CMMS, the alert-to-action gap averages 18–36 hours as alerts sit in inboxes — well beyond the window for many fast-onset bearing failures where the P-F interval is under 72 hours.
Step-by-Step: Banner DXM to Oxmaint Integration
This guide covers the complete commissioning sequence — from hardware pre-check through ongoing baseline refinement. Each step includes a verification checklist so commissioning engineers can confirm success before proceeding.
Confirm firmware versions on each component. DXM100 requires firmware v4.0 or later for REST API output; earlier versions support Modbus TCP only. Document each sensor node's device ID, mounting location, asset name, and measurement type. This node inventory becomes the register map reference for CMMS asset matching — without it, later troubleshooting becomes a full re-survey.
Using DXM Configuration Tool, bind each Q45 or QM30VT node to the DXM100. Set scan interval — 1 minute for critical assets, 5–15 minutes for secondary assets. Assign each node a unique Local Register address. QM30VT nodes output vibration RMS (4–20mA mapped value) and temperature on separate registers per measurement axis. Verify RSSI signal strength above -85 dBm for each bound node.
In DXM Configuration Tool, navigate to the I/O Rules editor and configure the Modbus TCP server settings: assign the DXM a static IP on the facility network, set port 502 (Modbus default), and map Local Register values to Modbus Holding Registers (40001+). Each sensor reading occupies one or two registers depending on data type. Document the final Modbus register map — this becomes the Oxmaint integration input reference.
In Oxmaint, navigate to Settings and add a new Modbus TCP connection with the DXM's static IP and port 502. For each sensor register, create a mapping: select the target asset from the Oxmaint asset registry, assign the measurement type (vibration RMS mm/s or temperature), and enter the Modbus register address. Oxmaint begins polling on the configured interval and populates the asset's condition history immediately after the first successful poll.
Once 7–14 days of baseline readings are collected, configure alert and alarm thresholds per asset. Oxmaint provides two threshold tiers: Alert (125–150% of baseline — monitor closely) and Alarm (175%+ of baseline — generate work order). For new installations without historical data, use ISO 10816 severity zone boundaries as initial thresholds: Alert at 4.5 mm/s RMS, Alarm at 7.1 mm/s RMS for machinery Class II (15–75 kW). Refine after 30 days of operational data.
Configure Oxmaint's auto work-order rules: when an Alarm threshold is breached, a work order is created automatically with priority level, asset details, fault type, and assigned technician or team. Set escalation rules for sustained Alert conditions: if a reading remains in the Alert band for more than 48 consecutive hours, escalate to Alarm priority. Configure notification recipients — mobile push, email, or both — per site and per asset criticality tier.
Perform a full integration test by temporarily lowering a threshold below the asset's current reading. Confirm that Oxmaint receives the register value within the configured poll interval, the threshold breach triggers the work order, the correct technician receives the notification, and the work order contains accurate asset details. Restore the threshold after validation and document test results in the asset record as the baseline commissioning entry.
After 30–60 days of live operation, review all asset baselines and refine thresholds based on operational data. Enable Oxmaint's CapEx forecasting module to begin projecting asset replacement costs from condition score trends. Establish a quarterly threshold review cadence — assets that have undergone maintenance or load changes will have shifted baselines. Condition-based CapEx reports can be generated from month 3 onward and shared directly with finance teams.
Connect Your DXM Gateway to Oxmaint Today
Most integrations go live within a single working day. From gateway IP configuration to first condition-based work order — Oxmaint is built for rapid deployment with no heavy implementation required.
DXM Integration Methods — Modbus TCP vs. REST API vs. Ethernet I/P
The Banner DXM100 supports three primary output protocols for CMMS integration. Choosing the right protocol depends on your network architecture, firmware version, and whether the CMMS is hosted on-premise or in the cloud.
| Integration Protocol | DXM Firmware Required | Best For | Network Requirement | Oxmaint Support |
|---|---|---|---|---|
| Modbus TCP/IP | All firmware versions | On-premise CMMS on isolated OT network | LAN connectivity, port 502 open | Full support — recommended for most deployments |
| REST API (HTTP POST) | v4.0 or later | Cloud-hosted CMMS with internet-accessible endpoint | Internet access through facility firewall | Full support — preferred for cloud deployments |
| Ethernet I/P | All firmware versions | Integration with existing PLC/SCADA on EtherNet/IP | EtherNet/IP capable network switch | Via SCADA bridge — contact support for config |
| Modbus RTU over Serial | All firmware versions | Legacy systems or environments without Ethernet | RS-485 serial connection to Modbus master | Via serial-to-Ethernet converter bridge |
| MQTT (via ScriptBasic) | v4.0 or later with scripting | IoT platforms and cloud data pipelines | Internet access, MQTT broker endpoint | Custom integration — API mapping required |
What Oxmaint Does Once DXM Data Starts Flowing
DXM integration is the data pipeline — Oxmaint is where that data becomes maintenance action, reliability intelligence, and capital planning evidence. These are the four capabilities that activate once integration goes live.
Every reading flows into the asset record, building a continuous trend history. Each asset carries a live condition score (1–100) updated with every sensor poll — giving reliability managers an instant portfolio-wide health view and the historical data needed to set defensible alarm thresholds.
When a sensor reading crosses a configured threshold, Oxmaint creates a work order automatically: asset identified, fault type described, priority set, technician notified, and spare parts pre-populated from the spare parts register. Detection-to-dispatch in under 60 seconds — the alert-to-action gap collapses from 18–36 hours to under one minute.
Sensor-driven maintenance history automatically feeds OEE calculations, MTBF, MTTR, and planned vs. unplanned maintenance ratios. Operations directors see live reliability KPIs without manually cross-referencing sensor logs against CMMS histories — all from the same platform that received the DXM data.
Condition score degradation rates feed Oxmaint's CapEx engine, projecting asset replacement costs 5–10 years forward. Finance receives investor-grade CapEx reports backed by real sensor degradation data — starting from month 3 of live integration — providing a defensible capital budget that doesn't rely on age-based guesswork.
Disconnected Sensors vs. CMMS-Integrated DXM Monitoring
The operational difference between running a DXM as a standalone logger versus integrating it with Oxmaint is not incremental — it is the difference between a data archive and a maintenance action system.
| Operational Dimension | DXM Without CMMS Integration | DXM Gateway + Oxmaint CMMS |
|---|---|---|
| Threshold Breach Response | Email alert to inbox — actioned in 18–36 hours on average | Work order auto-created and technician notified in under 60 seconds |
| Asset-Sensor Traceability | Register number — no direct link to asset name or location | Every reading linked to named asset, site, system, and component |
| Maintenance History Correlation | Manual cross-reference of two separate platforms required | Sensor trend and work order history on the same asset timeline |
| Condition-Based Scheduling | Calendar PM schedule unchanged by sensor readings | Sensor condition scores dynamically inform PM scheduling priority |
| Multi-Site Visibility | One gateway log per site — no consolidated portfolio view | All gateway data aggregated in single portfolio health dashboard |
| CapEx Forecasting | Sensor data never reaches capital planning model | Condition score trends feed 5–10yr CapEx replacement projections |
| GMP and Audit Compliance | Sensor logs separate from maintenance records — audit gap | Unified timestamped record: reading, alert, WO, sign-off, part used |
Banner DXM to CMMS Integration — Common Questions
Oxmaint supports both integration paths. Modbus TCP (port 502) works on all DXM firmware versions and is the most common for isolated OT network deployments. REST API push integration is available on DXM firmware v4.0 and later — the DXM can be configured to POST sensor readings to the Oxmaint API endpoint at each scan interval. REST is preferred for cloud-hosted CMMS deployments; Modbus TCP for on-premise deployments. Both deliver readings to the same Oxmaint asset records and trigger the same work order automation. Book a demo to confirm the right path for your network configuration.
Oxmaint supports unlimited gateway connections per account — each DXM is configured as a separate IoT data source with its own IP address, register map, and asset assignments. Facilities with multiple buildings or process areas typically deploy one DXM per zone (covering 20–47 nodes per gateway) and connect all gateways to the same Oxmaint account. The portfolio dashboard aggregates all gateway data across every site, enabling a single health view regardless of how many DXM controllers are deployed. Sign up for Oxmaint to begin your multi-gateway configuration.
The DXM100 stores readings locally in its internal register table even when network connectivity is interrupted. On reconnection, Oxmaint's integration layer can be configured to request a backfill of stored values for the gap period — ensuring no condition data is lost during brief network outages. For extended outages, the DXM's local alarm logic can be configured to trigger a local relay output as a backup alert mechanism independent of CMMS connectivity, providing a hardware failsafe while network issues are resolved.
For a single-gateway deployment with 10–20 nodes already bound and configured: network configuration and Modbus setup takes 1–2 hours; Oxmaint asset mapping and register assignment takes 1–3 hours depending on asset count; threshold configuration requires 7–14 days of baseline data collection before reliable thresholds can be set. The end-to-end timeline from starting integration to receiving the first condition-based work order is typically 10–15 working days. The first alarm-triggered work order usually fires within 30–60 days of live operation. Start a free trial to begin today.
Yes. Oxmaint's IoT integration layer accepts data over Modbus TCP/IP, Modbus RTU, REST API, and MQTT from any Modbus-capable or REST-capable gateway — including SKF, Emerson, Fluke, and custom industrial IoT platforms. The integration approach is identical: configure the data source, map registers to Oxmaint asset records, set thresholds, and enable work order automation. Book a demo to confirm support for your specific sensor platform.
Your Sensors Are Running. Now Make Them Act.
Connect your Banner DXM gateway to Oxmaint and turn every threshold breach into a planned work order — automatically. No more alert inboxes, no more data silos, no more failures between inspection cycles. Live in days, measurable results in 30.