A $340 million municipal utility presented its 2024 capital budget on a Tuesday morning in October. By Thursday, the main lift-station pump they had planned to replace in year four failed in the middle of a heavy-rain event and forced an emergency $1.1M procurement at 4.8x the planned cost. The pump's vibration trend had been rising for eleven months in the CMMS. Nobody on the capital planning committee had seen the data because capital planning and maintenance lived in different spreadsheets, different software, and different meetings. This is the gap CMMS-driven capital planning closes. Start a free trial of OxMaint to connect maintenance signals directly into your CapEx forecast, or book a demo to see how finance teams build rolling 5-year plans from the same data operations uses every day.
Capital Planning · CapEx Forecasting · RUL
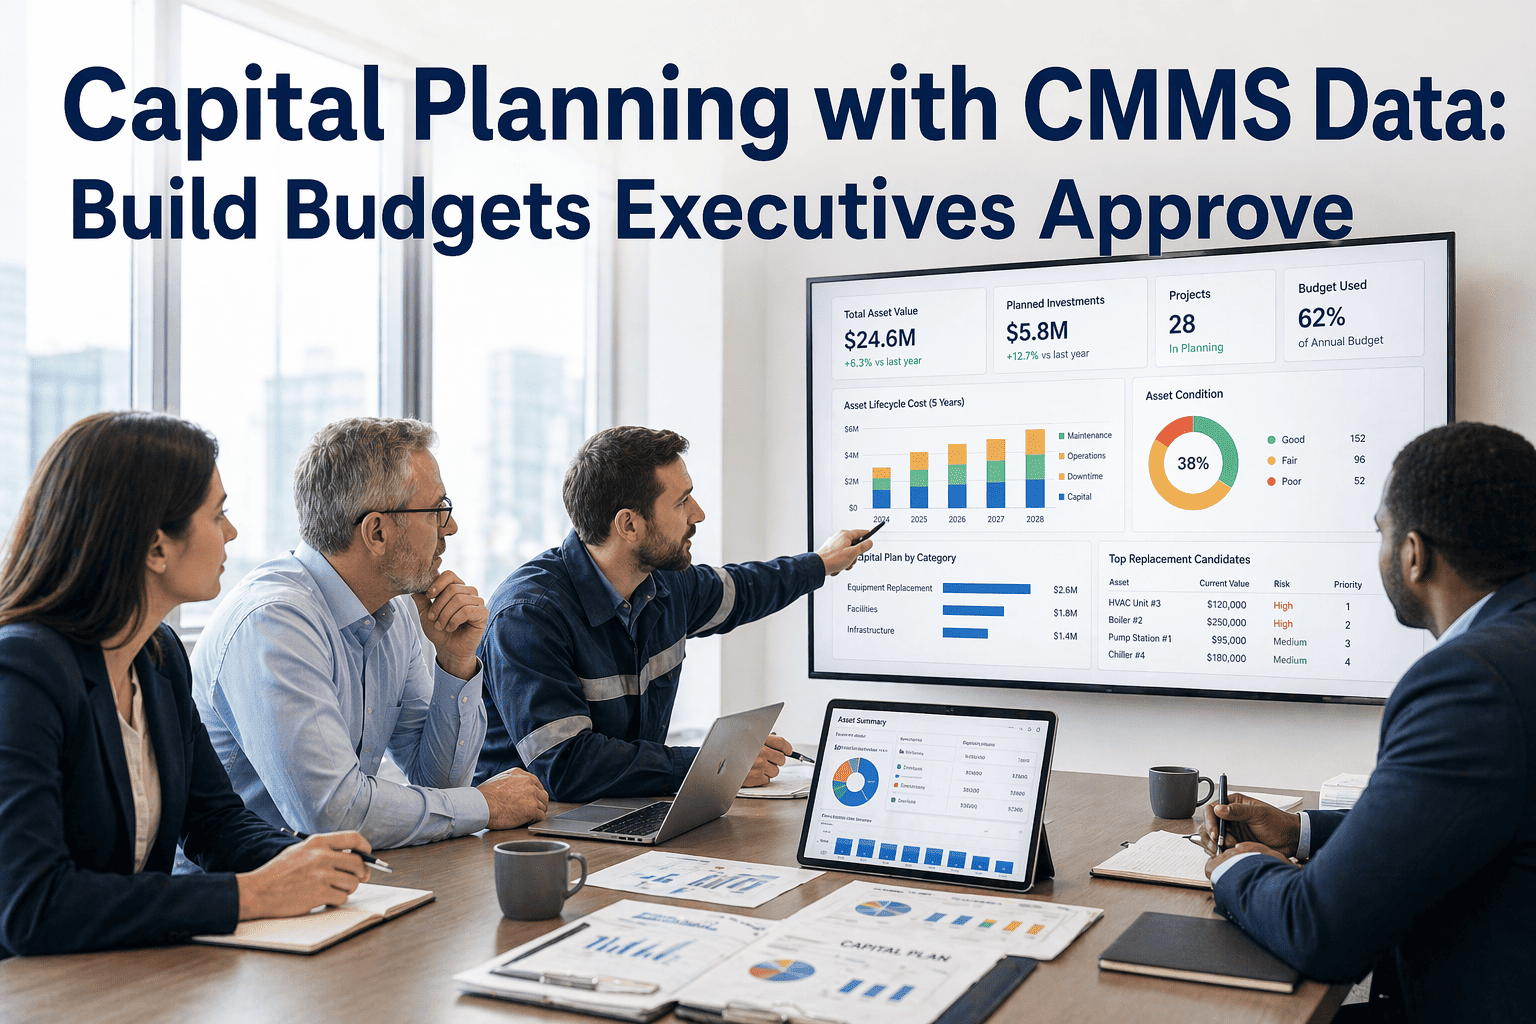
Capital Planning With CMMS Data: How Maintenance History Turns a Guessing Exercise Into a Forecast
Traditional CapEx plans rely on depreciation schedules, vendor quotes, and institutional memory. CMMS-driven planning uses actual work order volume, failure trends, energy drift, and Remaining Useful Life to forecast replacement spend 5–10 years out with variance under 15% — instead of the 40–65% variance that defines most manually built plans.
4.8x
Emergency procurement premium vs planned capital replacement
40–65%
CapEx plan variance for organisations without maintenance data integration
3–4x
CMMS return on investment typically recovered within the first 18 months
$84B
Deferred maintenance backlog in California alone — the cost of underfunded plans
Still building next year's CapEx from last year's CapEx plus inflation?
That method misses condition, utilisation, and failure trend — the three variables that actually determine when an asset needs replacing. Bring real maintenance data to the next budget cycle.
What CMMS-Driven Capital Planning Actually Means
Capital planning with CMMS data replaces the traditional depreciation-plus-inflation forecast with a condition-based, utilisation-weighted model. Instead of assuming every pump will be replaced at year 15 because that was the design life, the model reads actual MTBF trends, vibration readings, energy drift, repair frequency, and work order cost accumulation to project the real Remaining Useful Life per asset. The output is a rolling 5–10 year CapEx forecast that updates every time the maintenance team closes a work order — not once a year during budget season. Finance gets a live picture. Operations gets a seat at the capital table. To see a live 5-year plan generated from two quarters of work order data, book a demo.
Why Spreadsheet CapEx Plans Keep Missing Their Targets
Data gap
Condition data sits in a different system
Work order history, vibration trends, and energy data live in the CMMS. The capital budget lives in Excel. The two never cross-reference, so condition is ignored in favour of age.
Design-life fallacy
Assets are retired on calendar, not evidence
A pump rated for 15 years may have 22 years of service left with the right PM, or 7 if it runs 24/7 in a harsh environment. Spreadsheets apply one number to every unit.
Inflation blindness
5–7% annual escalators applied uniformly
Manual plans apply a flat inflation rate across all categories. Real data shows electrical equipment moving at different cost curves than pumps, HVAC, or conveyors — and ignores commodity spikes entirely.
Surprise events
35–50% of annual CapEx is unplanned
Structured forecasting with CMMS signals avoids the majority of these surprise capital events. Without it, emergency procurement at 4.8x planned cost becomes a line item.
No traceability
Board questions cannot be answered
When a board asks why asset X is scheduled for year 3 replacement, the spreadsheet owner points at the cell. A CMMS-backed plan points at 18 months of repair cost accumulation and an MTBF curve.
Siloed priorities
Finance and operations argue instead of align
Without a shared data source, capital disputes become opinion vs opinion. Shared CMMS metrics move the conversation from "I think" to "the failure rate shows" — a structurally different meeting.
The 5-Year CapEx Forecast: What a CMMS-Driven Plan Actually Looks Like
Projected Capital Replacement Spend — Mid-Size Industrial Plant (Illustrative)
Rotating Equipment
Electrical & Controls
HVAC & Process Cooling
Conveyance & Material Handling
Forecast includes 5–7% annual inflation escalator and 10–15% contingency on projects over $50K. Updated automatically as new work order and condition data arrives in the CMMS.
How OxMaint Builds the Forecast From Data You Already Have
Step 01
Asset registry consolidation
Every asset gets a record with install date, design life, replacement cost estimate, and criticality tier. Imports in bulk from spreadsheets, ERP exports, or existing CMMS systems.
Step 02
Work order cost accumulation
Trailing-12-month repair cost is calculated per asset automatically. When this number crosses 50% or 75% of replacement cost, the asset flags for CapEx review.
Step 03
Condition signal integration
Vibration, temperature, ultrasonic, and energy data feed into a Condition Adjustment Factor (0.5–0.8 for poor condition) that shortens or extends the forecast RUL.
Step 04
RUL calculation per asset
Remaining Useful Life = Design Life − Age − Condition Adjustment Factor. Updates every time condition or work order data changes, keeping the plan live instead of annual.
Step 05
Rolling 5–10 year projection
Replacement years cluster automatically into annual buckets. Finance sees the wave pattern, plans debt issuance around it, and smooths spikes with strategic deferrals or advances.
Step 06
Scenario & contingency modelling
Baseline, accelerated, and deferred scenarios run side by side. Contingency of 10–15% applied automatically to projects over $50K. Output ties directly into the ERP capital module.
Remaining Useful Life: Seeing the Cliff Before You Fall Off It
RUL is the single most important number in CMMS-driven capital planning. It tells finance when an asset will most likely need replacing — not when the warranty says, not when the depreciation schedule says, but when the condition data projects. OxMaint colour-codes every asset by urgency band so finance and operations can scan hundreds of assets in seconds and see which ones enter the planning window this year, next year, or five years out. Start a free trial and see your RUL board populate from the first work order imported.
Sample RUL Board — Critical Assets
< 1 yr · 1–3 yr · 3–5 yr · 5+ yr
Cooling Tower #2
0.6 yr
Plan this year
Lift Station Pump A
1.1 yr
Plan this year
Boiler Feed Pump 3
2.1 yr
Next cycle
MCC Switchgear B
2.8 yr
Next cycle
AHU-04 Compressor
4.3 yr
Mid-term
Process Chiller 1
4.8 yr
Mid-term
Main Conveyor Drive
6.5 yr
Monitor
Emergency Generator
7.4 yr
Monitor
Spreadsheet-Built Plans vs CMMS-Driven Plans
| Capital Planning Dimension | Traditional Spreadsheet | CMMS-Driven Forecast |
|---|
| Replacement trigger | Age + depreciation schedule | Age + condition + work order cost accumulation |
| Forecast variance | 40–65% variance typical | Under 15% variance with 12+ months of data |
| Update cadence | Annual during budget cycle | Live — refreshed on every work order close |
| Inflation handling | Flat 5–7% across all categories | Category-specific indices with commodity tracking |
| Surprise events (unplanned CapEx) | Absorbs 35–50% of annual CapEx | Reduced to 8–15% with condition-based forecasting |
| Board defensibility | Institutional memory & spreadsheet cells | Data trail: work orders, costs, RUL, condition signals |
| Contingency rigor | Round number applied to total | 10–15% applied per project > $50K with risk weighting |
The Numbers CMMS-Driven Planning Delivers
3–4x
CMMS return on investment
Typical payback within 18 months of deployment
35–50%
Surprise CapEx events avoided
Through structured, condition-based forecasting
< 15%
Forecast variance achievable
Compared to 40–65% variance without maintenance data
4.8x
Emergency cost avoided
Per asset moved from reactive to planned replacement
Four Mistakes That Quietly Break Capital Plans
Mistake 01
Treating RUL as a fixed number
RUL changes every quarter as condition data evolves. Plans that lock it in at budget time and never revisit produce the same variance they were built to eliminate.
Mistake 02
Skipping contingency on small projects
Contingency of 10–15% on projects over $50K is a bare minimum. Skipping it on a $75K pump replacement that drifts to $92K puts the whole quarter out of plan.
Mistake 03
Ignoring the 50% vs 75% rule choice
The 75% rule (repair cost > 75% of replacement) is conservative. For critical production assets, a 50% threshold protects uptime. Plans that apply one rule everywhere lose money both ways.
Mistake 04
Leaving operations out of the review
Finance owns the plan. Maintenance owns the data. A review meeting without both sides creates rubber-stamped numbers that fail the next surprise failure test.
Frequently Asked Questions
How much historical CMMS data do we need before the forecast is reliable?
Twelve months of work order data produces a defensible baseline. 24 months produces a strong forecast with category-level inflation indices. Organisations starting fresh can still use RUL projections from design life and condition inspections while the work order history accrues.
Book a demo to see the minimum-data scenario.
Does OxMaint export the forecast directly into our finance/ERP system?
Yes. OxMaint exports 5-year and 10-year CapEx forecasts in formats compatible with SAP, Oracle, NetSuite, Microsoft Dynamics, and most mid-market ERPs via API. Finance teams work from the same source of truth as operations without maintaining duplicate spreadsheets.
How does the system handle assets without condition monitoring sensors?
Work order frequency, repair cost accumulation, and manual inspection readings are valid condition proxies. OxMaint uses whatever data is available and weights the RUL output by data confidence. As sensors get added, the forecast sharpens automatically.
Can the plan be scenario-tested — aggressive replacement vs deferred?
Yes. Three standard scenarios run side by side: baseline, accelerated (all <3 year RUL replaced immediately), and deferred (stretch-and-patch with elevated repair budget). Finance and operations review the tradeoffs with real downtime and cost projections, not opinions.
Start a free trial to run your own scenarios.
Move Capital Planning From Annual Guesswork to Continuous Forecast
OxMaint turns your existing work orders, condition data, and asset registry into a live 5–10 year CapEx forecast that finance and operations share. Under 15% variance. 3–4x ROI. Surprise capital events cut by half. Start with a trial, or talk to an expert about your portfolio.